BLOGS
BLOGS  NEWSROOM
  CASE STUDIES
  WEBINARS
  PODCASTS
  ASSET HUB
  EVENT CALENDAR


TL;DR
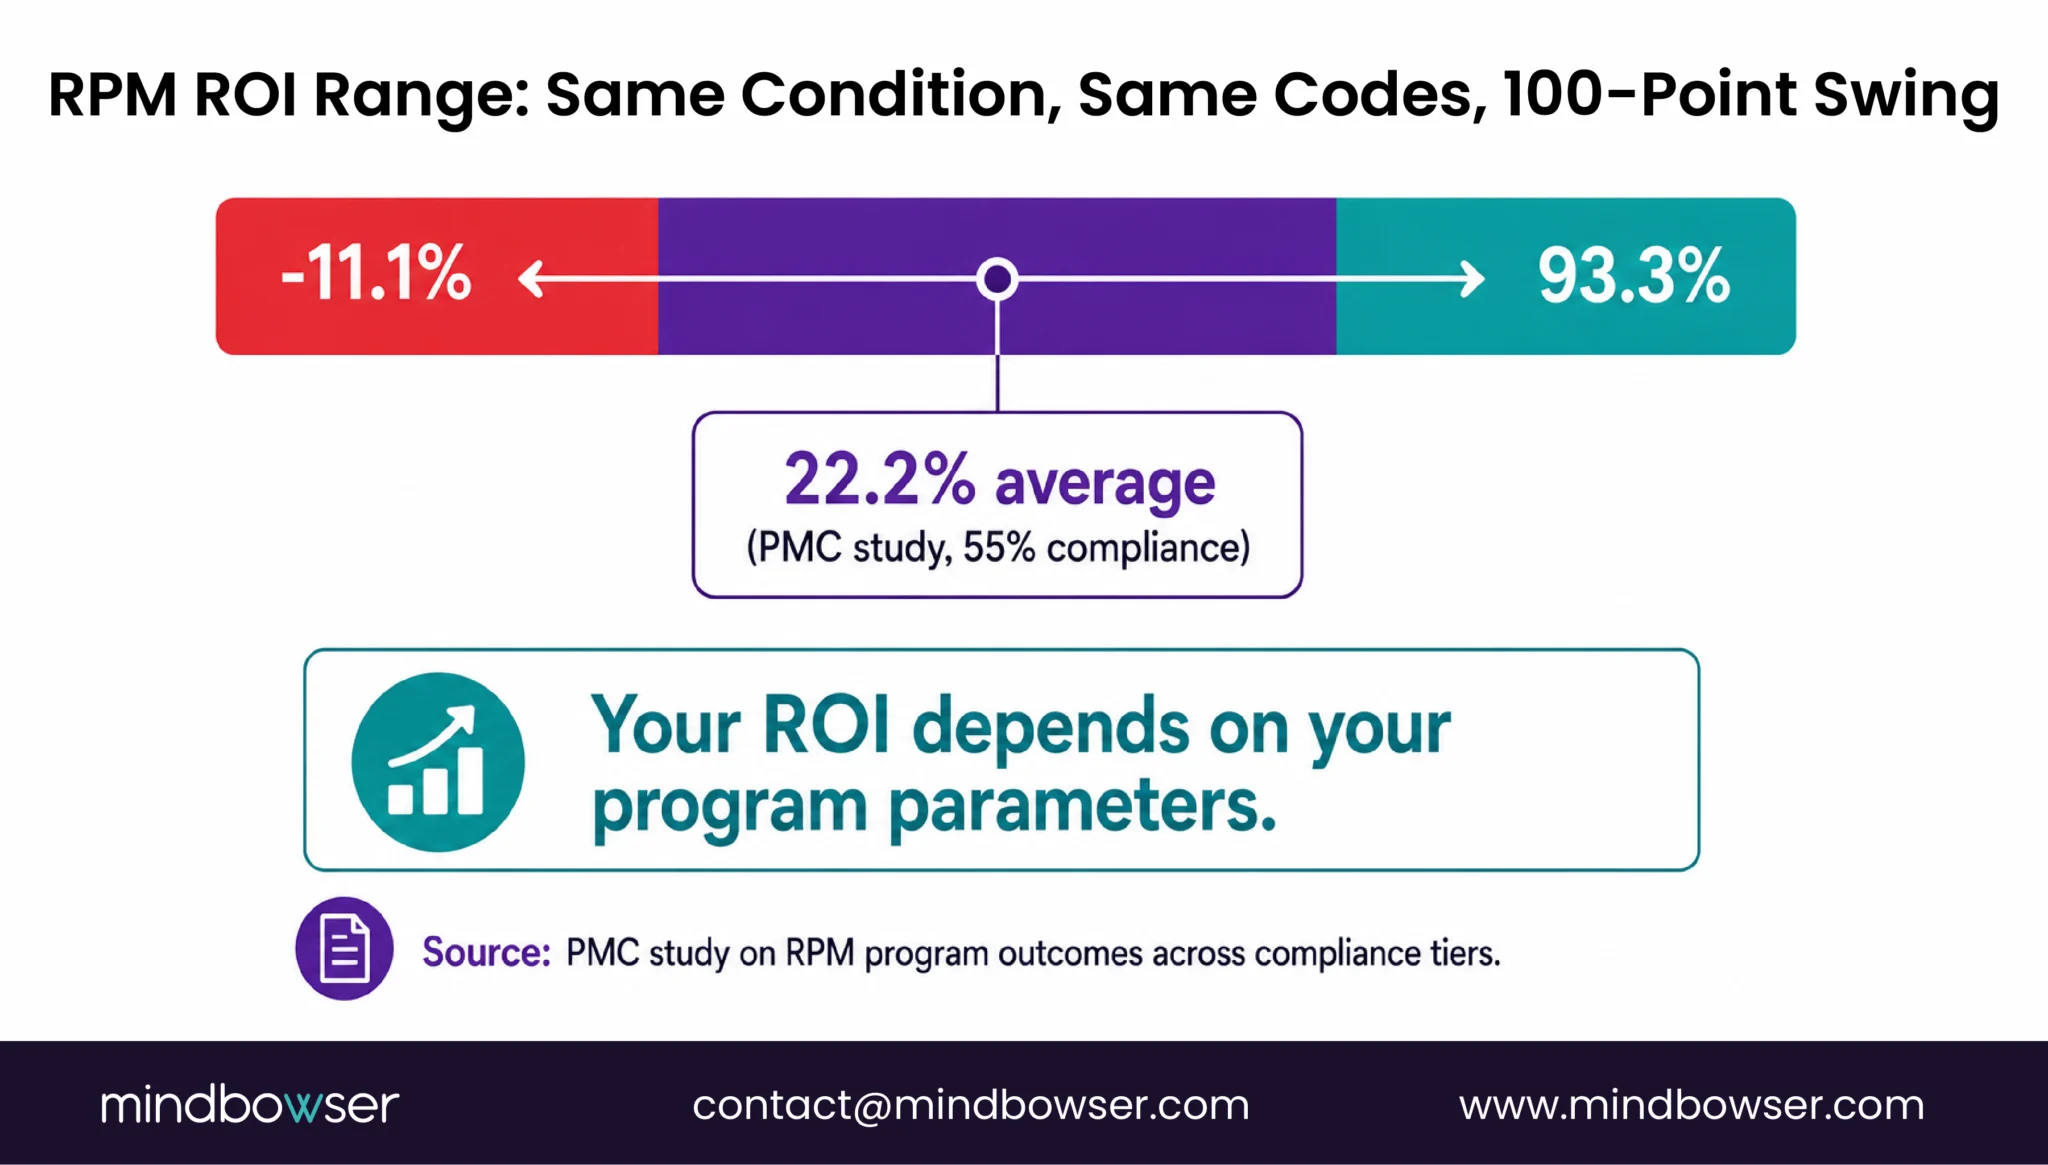
- Every CFO asks the same question before approving an RPM program: What is the ROI? Industry averages say “4-7x return,” but a 2026 PMC study on hypertension RPM found ROI ranging from -11.1% to 93.3% depending on program cost assumptions (PMC, 2026).
- Your number depends on your payer mix, patient compliance, staffing model, and condition mix. This calculator uses your inputs to generate your projections.
- Not ranges from a blog post. A financial model from your actual program parameters.
Why Generic RPM ROI Numbers Don’t Work
RPM revenue articles cite $120-150 per patient per month as if that number applies equally to a 25-patient primary care pilot and a 1,000-patient cardiac program. It does not.
The variation is enormous. A PMC study published in 2026 analyzed the cost and ROI of a hypertension RPM program and found an average program cost of $330 per patient, with a range from $208 to $452. The resulting ROI averaged 22.2% at 55% patient compliance, but ranged from -11.1% (at the high cost end) to 93.3% (at the low cost end). Same condition. Same CPT codes. Nearly a 100-percentage-point ROI swing based on operational efficiency.
The variables that drive this swing:
- Payer mix. Medicare fee-for-service (FFS) reimburses every RPM code.. UHC excluded chronic hypertension, diabetes, and COPD from RPM coverage in 2026 (heart failure and pregnancy hypertension still covered). A program where 40% of patients are on UHC commercial plans has a fundamentally different revenue ceiling than one where 80% are Medicare FFS.
- Compliance rate. Standard RPM billing (99454) requires 16 days of device data per 30-day period. Patients who monitor only 12 days generate zero revenue under 99454. The 2026 short-duration code 99445 captures 2-15 day patients, but at lower reimbursement for the treatment management component. Compliance rate directly scales revenue.
- Staffing model. A care manager at 1:85 patient ratio (with AI triage) costs $73 per patient per month in loaded salary. At 1:35 ratio (without AI triage), that jumps to $179. The triage investment changes the staffing economics by 2.5x and helps reduce RPM alert fatigue.
- Condition mix. Heart failure RPM generates both billing revenue AND readmission cost avoidance ($13,000 per prevented readmission in this model). Hypertension generates strong billing revenue but lower per-patient cost avoidance. The total value per patient varies by condition.
The calculator below accounts for all four variables. Enter your numbers. Get your projection.
RPM ROI Calculator
Revenue Modeling • Cost Analysis • Readmission Savings • Break-Even
Program Inputs
Payer Mix (must sum to 100%)
Key Assumptions (CPT rates)
| CPT 99453 (setup, one-time) | $19 |
| CPT 99454 (device, monthly) | $43 |
| CPT 99457 (first 20 min) | $48 |
| CPT 99458 (add’l 20 min) | $39 |
| CCM 99490 (monthly) | $62 |
| BHI 99484 (monthly) | $48 |
| Overhead | 15% of revenue |
| Avg readmission cost | $15,200 |
Revenue Breakdown by CPT (Monthly)
Cost Breakdown
ROI Gauge
12-Month Cumulative: Revenue vs Cost
Financial Summary & Line-Item Breakdown
Adjust the inputs above to model your program.
| Line item | Monthly | Annual |
|---|
Want to build an RPM platform that captures this revenue? Talk to our team →
Download Your Report
Get a personalized PDF with your RPM revenue projection.
What the Calculator Models
Inputs You Provide
Program size and patient population:
- Number of enrolled patients (25 to 2,000)
- Primary condition (hypertension, diabetes, heart failure, COPD, or multi-condition)
- Payer mix: percentage breakdown across Medicare FFS, UnitedHealthcare, other commercial, and Medicaid
Program operations:
- Monitoring compliance rate: percentage of patients hitting the 16-day device data threshold (typical range: 55-85%)
- Program stacking: RPM only, RPM + CCM, or RPM + Chronic Care Management (CCM) + Behavioral Health Integration (BHI)
- Staffing approach: existing staff, dedicated care manager, or outsourced
- AI alert triage: yes or no (affects care manager ratio and therefore staffing cost)
Technology and devices:
- RPM platform cost per patient per month ($5-30 range)
- Device type: cellular ($100/unit) or Bluetooth ($50/unit). For device selection, connectivity tradeoffs, and estimated device costs, see our remote patient monitoring devices list.
Outputs Generated
Revenue projection:
- Monthly RPM billing revenue broken down by CPT code (99453, 99454/99445, 99457/99470, 99458)
- Monthly CCM revenue if stacking is selected (99490, 99439)
- Monthly Behavioral Health Integration (BHI) revenue if triple-stack selected (99484)
- Revenue adjusted for payer mix (UHC-enrolled patients excluded from non-covered conditions)
- Revenue adjusted for compliance rate (patients below 16-day threshold billed under 99445 instead of 99454)
Cost projection:
- Monthly staffing cost (care managers at a ratio determined by AI triage selection + program coordinator at 200+ patients)
- Monthly platform cost (patient count multiplied by per-patient rate)
- Monthly device cost (amortized over lifecycle + 8% annual replacement)
- Overhead (15% of gross revenue for billing, administration, quality reporting)
Program economics:
- Net monthly margin (revenue minus costs)
- Annual program revenue
- Annual program cost
- Annual net margin
- ROI percentage
- Breakeven month (when cumulative revenue exceeds cumulative costs, including startup)
Cost avoidance (condition-specific):
- Estimated readmission cost avoidance based on condition, baseline readmission rate, and RPM-demonstrated reduction rate
- Annual cost avoidance dollar value
- Total annual program value (billing revenue + cost avoidance)
Downloadable output: PDF summary of all projections (email-gated for lead capture)
Build a Custom RPM Financial Model for Your Budget Committee
The Math Behind the Calculator
Every formula in the calculator uses published CMS rates and peer-reviewed cost data. No proprietary assumptions without sourcing.
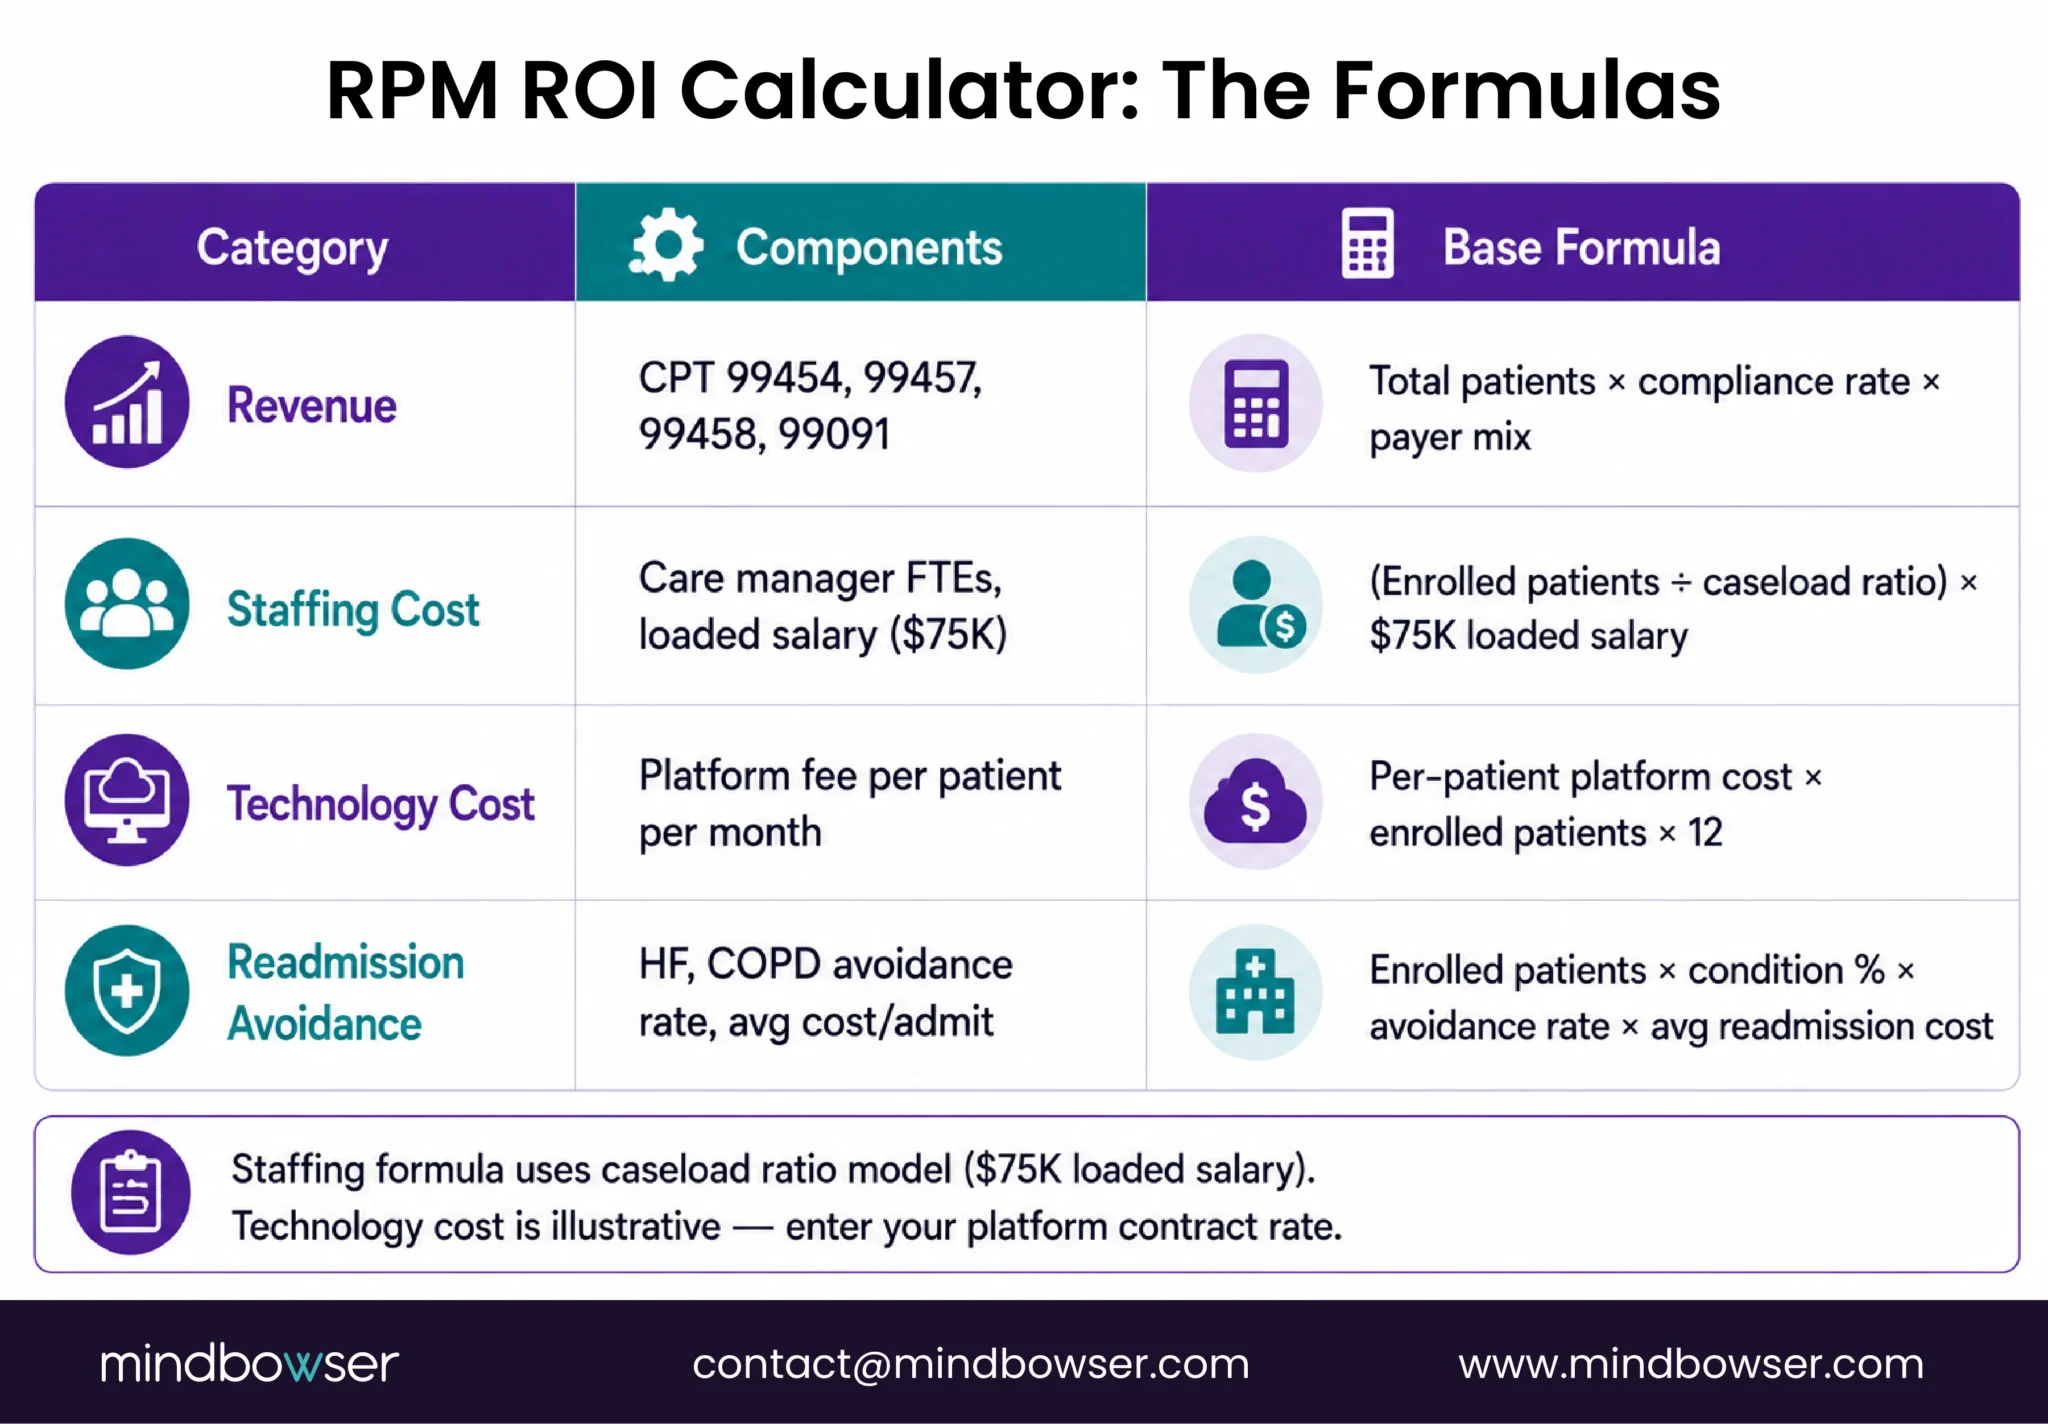
Revenue Formulas
RPM billing revenue per month:
Billable patients = total patients × compliance rate × (1 - UHC exclusion %)
Standard RPM revenue = billable patients × (99454 rate + 99457 rate)
Short-duration patients = total patients × (1 - compliance rate) × eligible %
Short-duration revenue = short-duration patients × (99445 rate + 99470 rate)
Total RPM revenue = standard + short-duration
CCM stacking revenue (if selected):
CCM eligible = total patients × CCM qualification rate (default 70%)
CCM revenue = CCM eligible × (99490 rate + 99439 rate × additional time %)
BHI stacking revenue (if selected):
BHI eligible = CCM eligible × BHI qualification rate (default 25%)
BHI revenue = BHI eligible × 99484 rate
Cost Formulas
Staffing:
Care managers needed = total patients ÷ CM ratio
CM ratio = 85 (with AI triage) or 35 (without)
CM cost = care managers × $75,000 loaded annual ÷ 12
Program coordinator = 1 FTE at 200+ patients ($55,000 ÷ 12)
Total staffing = CM cost + coordinator (if applicable)
Technology:
Platform cost = total patients × per-patient monthly rate
Device amortization = (total patients × per-unit cost) ÷ lifecycle months
Device replacement = total deployed × 8% annual ÷ 12
Total technology = platform + device amortization + replacement
Overhead:
Overhead = total gross revenue × 15%Readmission Avoidance Formulas
Avoidable readmissions = patients × baseline readmission rate × RPM reduction %
Annual avoidance value = avoidable readmissions × average readmission cost
Condition-specific constants:
| Condition | Baseline Readmission Rate | RPM Reduction | Avg Readmission Cost | Annual Avoidance/Patient |
|---|---|---|---|---|
| Heart failure | 20% | 50% | $13,000 | $1,300 |
| COPD | 18% | 40% | $10,000 | $720 |
| Diabetes | 12% | 30% | $8,500 | $306 |
| Hypertension | 8% | 25% | $7,000 | $140 |
Sources: AHRQ readmission data, AJMC 2025 (cardiac 50% reduction), PMC studies, HealthArc benchmarks.
Sample Scenarios
Three scenarios representing common program profiles. Run these in the calculator to validate, then adjust to your own numbers.
Scenario A: Small Primary Care Practice, 50 HTN Patients, RPM Only
| Input | Value |
|---|---|
| Patients | 50 |
| Condition | Hypertension |
| Payer mix | 60% Medicare FFS, 10% UHC, 20% other commercial, 10% Medicaid |
| Compliance | 70% |
| Stacking | RPM only |
| Staffing | Existing staff |
| Platform | $10/pt/mo |
| Device | Cellular ($100) |
Projected output:
- Monthly revenue: ~$4,200
- Monthly costs: ~$1,800
- Net margin: ~$2,400/month ($28,800/year)
- ROI: 133%
- Breakeven: month 2
For the full primary care RPM playbook, see our RPM for primary care guide.
Scenario B: Mid-Size Health System, 300 Multi-Condition, RPM + CCM
| Input | Value |
|---|---|
| Patients | 300 |
| Condition | Multi-condition (HTN + DM + HF mix) |
| Payer mix | 50% Medicare FFS, 15% UHC, 25% other commercial, 10% Medicaid |
| Compliance | 75% |
| Stacking | RPM + CCM |
| Staffing | Dedicated CM (with AI triage) |
| Platform | $15/pt/mo |
| Device | Cellular ($100) |
Projected output:
- Monthly revenue: ~$48,000 (RPM) + ~$15,500 (CCM) = ~$63,500
- Monthly costs: ~$26,000
- Net margin: ~$37,500/month ($450,000/year)
- ROI: 144%
- Breakeven: month 2
For concurrent billing details, see our RPM + CCM stacking guide. For practices evaluating the broader care-management workflow, see our Chronic Care Management guide.
Scenario C: Large System, 1,000 HF Patients, RPM + CCM + Readmission Avoidance
| Input | Value |
|---|---|
| Patients | 1,000 |
| Condition | Heart failure |
| Payer mix | 65% Medicare FFS, 10% UHC, 15% other commercial, 10% Medicaid |
| Compliance | 80% |
| Stacking | RPM + CCM |
| Staffing | Dedicated CM team (with AI triage) |
| Platform | $12/pt/mo |
| Device | Cellular ($100) |
Projected output:
- Monthly billing revenue: ~$175,000
- Monthly costs: ~$85,000
- Monthly readmission avoidance: ~$108,000
- Net program value: ~$198,000/month ($2.38M/year)
- ROI: 233%
- Breakeven: month 1
For cardiac RPM details, including Hospital Readmissions Reduction Program (HRRP) penalty offset, see our cardiac RPM guide. For the operational infrastructure to run at 1,000 patients, device inventory, patient onboarding, and return workflows, see our RPM scaling guide.
For a real-world example of remote cardiac rehabilitation infrastructure, see our cardiac rehab RPM platform case study.
How to Use This Calculator in a Business Case
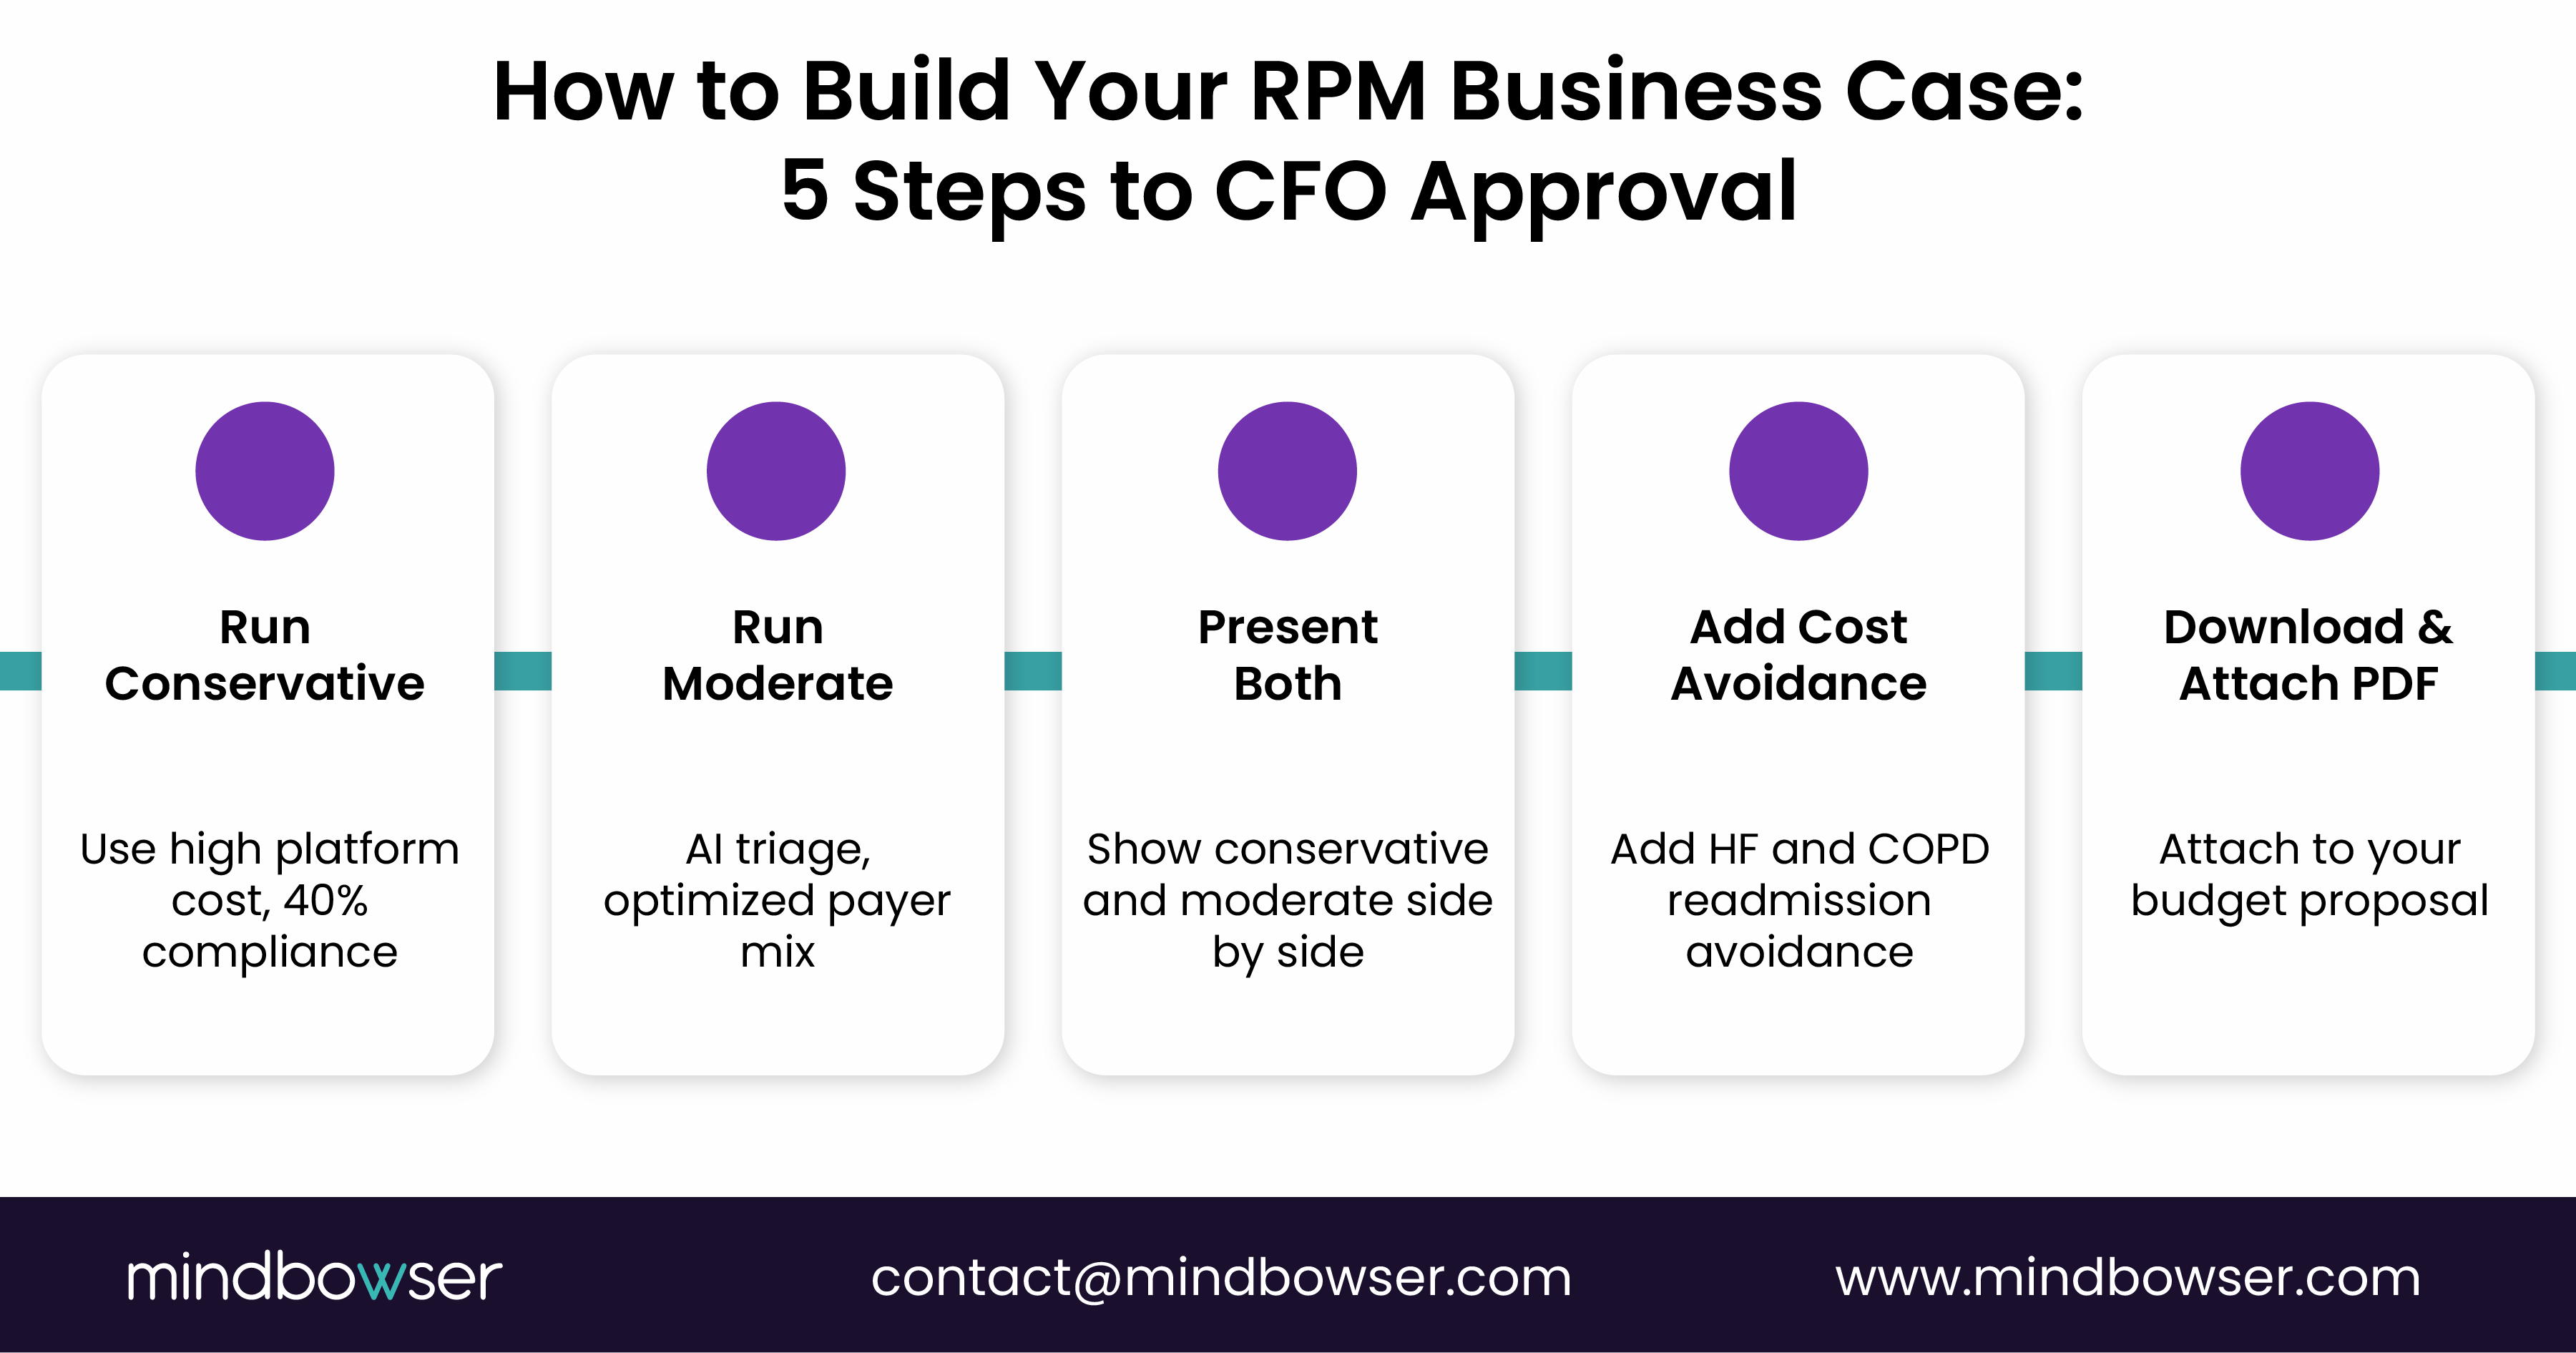
The calculator is designed to produce the two numbers every CFO needs: net annual program value and breakeven month.
- Step 1: Run conservative. Set compliance at 55%, staffing without AI triage, platform cost at the high end ($25/pt/mo), and UHC percentage at your actual level. This is your floor.
- Step 2: Run moderate. Set compliance at 70%, staffing with AI triage, platform at mid-range ($12/pt/mo). This is your likely operating point after 6 months.
- Step 3: Present both. “At conservative assumptions, the program breaks even in month 3 and generates $X in year one. At moderate assumptions, breakeven is month 2 and year one value is $Y. Both scenarios assume we start with [number] patients and scale to [number] by month 6.”
- Step 4: Add cost avoidance for cardiac and COPD programs. The readmission avoidance line is often larger than the billing revenue for heart failure programs. A CFO who sees $175K/month in billing revenue AND $108K/month in avoided readmission costs is looking at a different decision than one who sees billing revenue alone.
- Step 5: Download the PDF and attach it to the budget proposal. The PDF summary includes all inputs, assumptions, formulas, and projected outputs in a format suitable for the finance committee.
Your Numbers, Not Industry Averages
Generic RPM ROI claims are marketing. “4-7x return” does not account for your payer mix, your patient compliance, your staffing model, or your condition distribution. The PMC study proved this: same condition, same codes, ROI ranging from negative to 93%.
This calculator exists because the RPM business case should be built on your data, not on vendor projections. Enter your numbers. Model your scenarios. Download the output. Present it to your CFO with the assumptions visible and the math transparent.
The programs that get funded are the ones that show the math. The programs that show the math with transparent assumptions are the ones that keep their funding when year-one results come in.
ROI varies dramatically by program parameters. A 2026 PMC study on hypertension RPM found ROI ranging from -11.1% to 93.3% depending on program cost assumptions, with an average of 22.2% at 55% patient compliance. Industry benchmarks for established programs cite 4-7x return at 200+ patients. The variation is driven by payer mix, compliance rate, staffing model, and whether cost avoidance (readmission reduction) is included in the calculation. Use the calculator above with your actual numbers rather than relying on averages.
Most programs break even in 2-3 months. The startup costs (device procurement, platform setup, staff training) are recovered quickly because RPM billing revenue begins in the first month of patient enrollment. At 50 patients with off-the-shelf platform and existing staff, startup costs of $3,500-5,000 are recovered by month 2-3. Larger programs with custom platforms and dedicated staff may take 3-4 months but generate proportionally larger ongoing margins.
Four components: (1) staffing, typically 40-55% of program cost (care managers at $75,000 loaded annual, ratio of 1:85 patients with AI triage or 1:35 without), (2) technology platform at $10-30 per patient per month (10-25% of cost), (3) devices at $50-100 per unit amortized over 18-24 months plus 8% annual replacement (10-15% of cost), (4) overhead including billing administration and quality reporting at approximately 15% of gross revenue. Staffing is the largest variable and the one most affected by AI triage deployment.
Significantly. Medicare FFS reimburses all RPM codes without condition restrictions. UnitedHealthcare excluded chronic hypertension, diabetes, and COPD from RPM coverage in 2026 (heart failure and pregnancy hypertension still covered). A program where 40% of patients are on UHC commercial plans loses 40% of its potential RPM revenue for excluded conditions. Run the calculator with your actual payer percentages. Programs with 70%+ Medicare FFS payer mix are minimally affected by UHC restrictions.
Condition-specific: heart failure RPM prevents an estimated $1,300 in readmission costs per patient per year (20% baseline rate × 50% reduction × $13,000 average cost). COPD: $720/patient/year. Diabetes: $306/patient/year. Hypertension: $140/patient/year. For a 500-patient heart failure program, annual readmission avoidance exceeds $650,000. These savings are separate from billing revenue and often exceed billing revenue for cardiac programs. Include both lines in ROI calculations for a complete program value picture.