BLOGS
BLOGS  NEWSROOM
  CASE STUDIES
  WEBINARS
  PODCASTS
  ASSET HUB
  EVENT CALENDAR


TL;DR
- Alert fatigue is the #1 operational killer of RPM programs. Care teams receiving 300 to 500 alerts daily for 200 patients, with false-positive rates hitting 80-90% (PMC scoping review, 2025), stop trusting the system by month two.
- The fix is not fewer alerts. It is smarter alerts: AI-powered triage that learns individual patient baselines and scores every reading against that patient’s normal, not a population average.
- Programs deploying personalized baselines report 60-80% reductions in false alarms while catching more true deterioration events. The programs that survive past year one all made the same architectural choice.
I sat across from an RPM program director last quarter who told me her care team processes 437 alerts per day for 200 patients. She estimated 90% of them are noise. Not 90% are low priority. Ninety percent generate zero clinical action. Her best care manager, 15 years of experience, had put in a transfer request the week before. Not to another department. Off the RPM program entirely.
That conversation is not unusual. I have some version of it every month. The RPM vendor demos look clean: color-coded dashboards, neat alert queues, satisfied-looking nurses in stock photos. Then the program goes live and the care team drowns in readings that don’t mean anything.
Alert fatigue does not kill patients directly. It kills RPM programs. And the programs that die from it all made the same mistake: they configured alerts for the device, not for the patient.
How Does Alert Fatigue Kill an RPM Program?
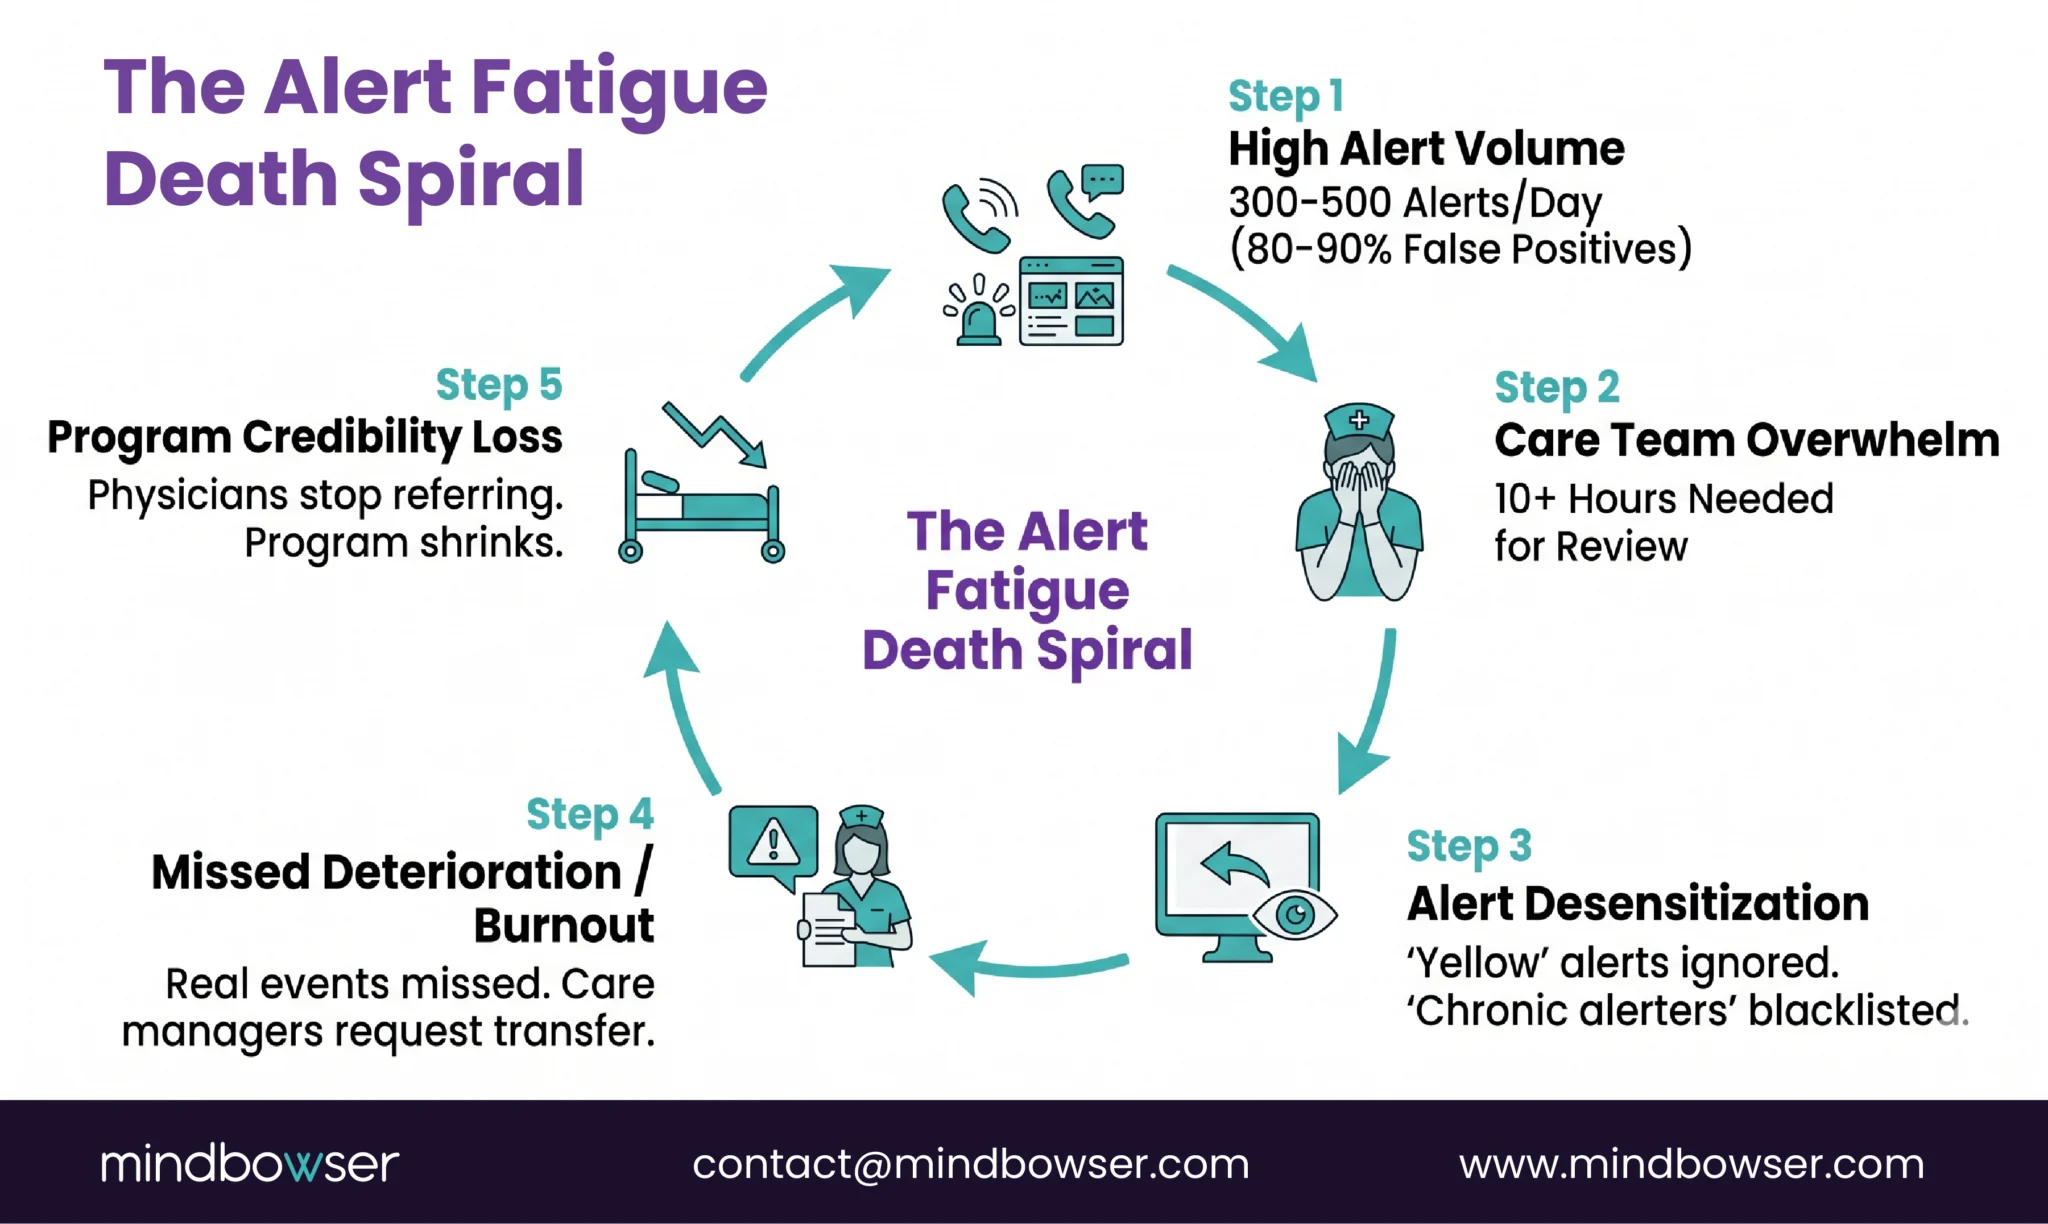
The death spiral follows a predictable pattern, and I’ve watched it play out at least a dozen times.
Month 1. The program launches. Care team is enthusiastic. Every alert is reviewed. Response times are fast. Patients get callbacks within hours.
Month 2. Alert volume is overwhelming. The team starts mentally categorizing: “this patient always triggers SpO2 alerts, ignore those.” Yellow alerts get skipped. Only reds get reviewed.
Month 3. Even red alerts lose urgency. The team has seen too many red alerts that turned out to be sensor errors or normal patient variation. Response times stretch from hours to days.
Month 4. A real deterioration event gets missed because it looked like every other false alarm. Or it doesn’t get missed, but the care manager who caught it is burned out and puts in a transfer request. Either way, the program loses credibility.
Month 6. Enrollment slows. Physicians stop referring patients. The program quietly shrinks. Nobody officially shuts it down, but it becomes a ghost: technically running, clinically irrelevant.
The numbers behind this pattern are documented. The AHRQ recognizes alert fatigue as a patient safety issue (AHRQ PSNet Primer). A 2025 PMC scoping review found false-positive rates of 80 to 90% in clinical monitoring environments. The average hospital physician receives more than 180 EHR alerts per day, with override rates above 95% for low-priority notifications. A Psychology Today analysis from 2025 linked alert fatigue to a more than 14% increase in medical errors.
Those are inpatient numbers. RPM programs running on static thresholds across a 200-patient panel generate comparable alert volumes with even fewer staff to triage them.
Before You Configure Another Alert, Check Our Latest Guide on Thresholds Your Program Should Be Using
Why Do RPM Programs Generate So Many False Alarms?
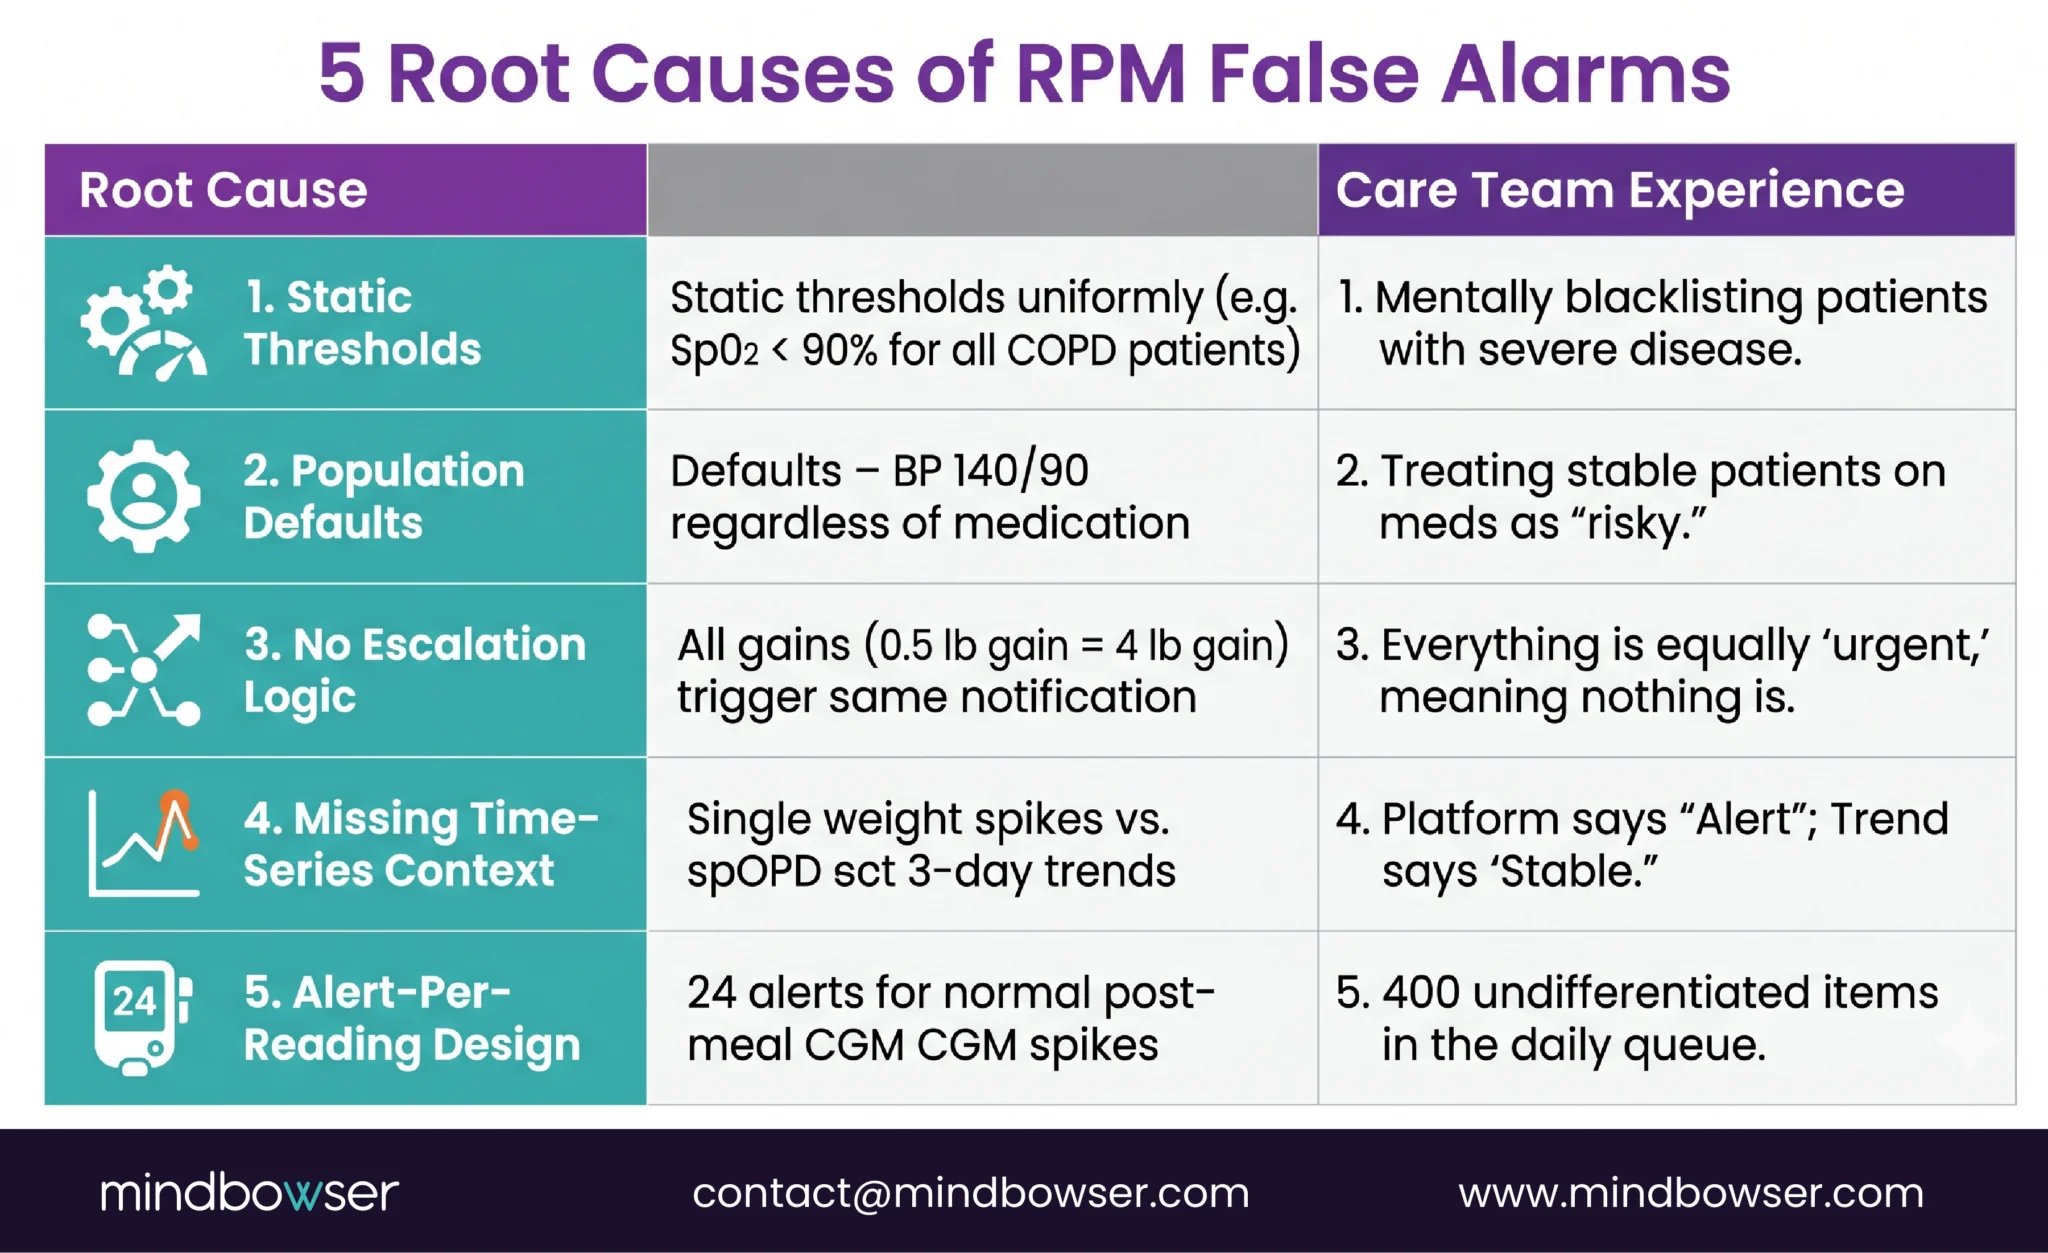
Five root causes, and most programs have all five running simultaneously.
Static thresholds applied uniformly. Setting SpO2 alerts at less than 90% for every COPD patient ignores that some patients live at a baseline of 89-91% because of advanced disease. Those patients trigger an alert every single reading. By week two, the care team has mentally blacklisted those patients’ SpO2 data. The real danger: when that patient’s SpO2 drops from 89% to 83% (a genuine emergency), it looks like another routine alarm.
Population-level defaults without patient-level context. “Blood pressure above 140/90 generates an alert” doesn’t account for the patient on three antihypertensives who is intentionally titrated to 135/85. Their occasional 142/88 reading is not concerning. But the system doesn’t know that.
No escalation logic. A slightly elevated weight (0.5 lb gain) and a critical fluid retention event (4 lb gain overnight) generate the same notification. The care team cannot prioritize at a glance because the system doesn’t distinguish severity. Everything is equally urgent, which means nothing is.
Missing time-series context. A weight gain of 2 pounds means nothing in isolation. Was it measured after a large meal? Is it trending up over three days? Did the patient just switch medications? Without temporal context, every single out-of-range reading looks alarming. A platform analyzing the trend says “stable with normal fluctuation.” A platform checking the last reading says “alert.”
Alert-per-reading design. Some platforms fire an alert for every out-of-range reading. A diabetes patient with a CGM generating 288 readings per day has a natural 2-hour postprandial glucose spike after every meal. That is normal physiology. An alert-per-reading design generates 24 alerts per day for normal eating behavior. Multiply by 200 patients and the care team is buried.
What Does Alert Fatigue Look Like on a Care Team?
At BRI 2026, Nicole Speeny presented on reducing clinician burnout through RPM workflow design. Her core point stuck with me: care teams do not burn out from caring for patients. They burn out from triaging noise. The emotional toll is not “I am overwhelmed by sick people.” It is “I spent eight hours reviewing alerts and none of them mattered, and I’m terrified that the one real emergency was buried in there somewhere and I missed it.”
I’ve had versions of this conversation with RPM program directors at six different organizations in the past year. The behavioral degradation follows the same pattern everywhere.
Week 1: the care manager opens every alert, reads the vitals, documents the review. Average time per alert: 90 seconds. Four hundred alerts times 90 seconds is 10 hours. There are not 10 hours in a work day for a care manager who also has calls, documentation, and care plan updates.
Week 4: yellow alerts are skipped entirely. Only orange and red alerts get reviewed. The care manager develops a mental list of “chronic alerters,” patients whose readings always trigger but who are never actually deteriorating. Those patients’ data stops being reviewed at all.
Week 8: a care manager at a Midwest health system I was advising said something I have not forgotten: “I’d rather go back to inpatient floor nursing than process another day of RPM alerts. At least on the floor, when the alarm goes off, it means something.”
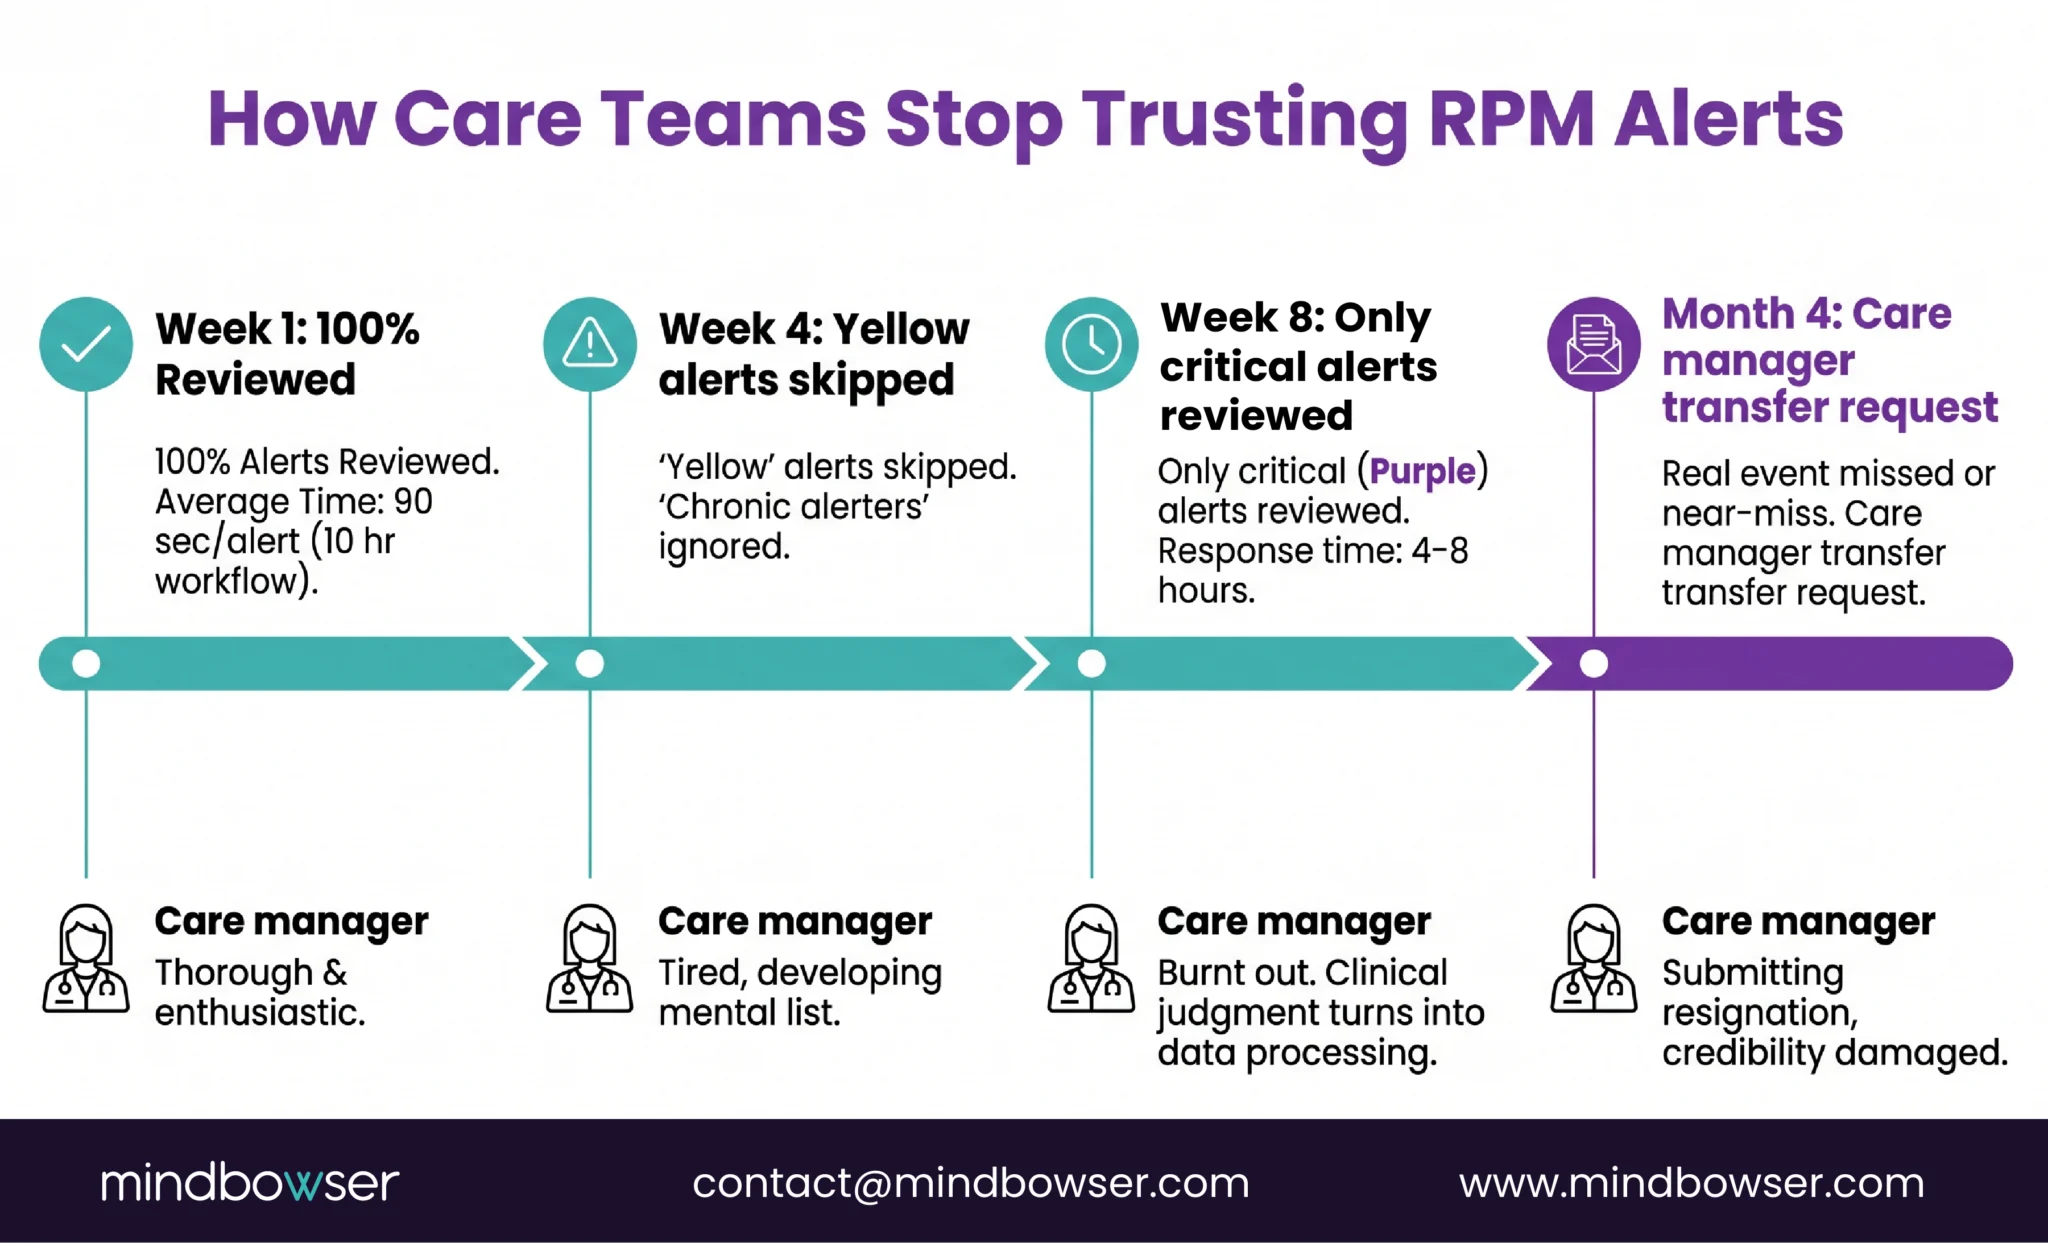
That care manager had 15 years of experience. She was not being dramatic. She was describing a system that had turned clinical judgment into data processing.
A JMIR systematic review published in 2025 found that general practitioners consistently reported alert fatigue as a primary barrier to clinical alert adoption. The finding was not that the alerts were wrong. It was that the volume made it impossible to identify which ones were right.
Deploy AI-powered alert triage in your existing RPM program
What Is Personalized Baseline Monitoring?
This is the architectural shift that separates programs that survive from programs that die.
Traditional RPM alert logic: compare each reading to a fixed population threshold. SpO2 below 90%? Alert. Blood pressure above 140/90? Alert. Weight up 2 pounds? Alert. The threshold is the same for every patient.
Personalized baseline monitoring: the system learns what normal looks like for each individual patient over 14 to 30 days of data. Then it alerts on deviations from that patient’s personal pattern, not from a population average.
Three patients. Same SpO2 reading of 91%.
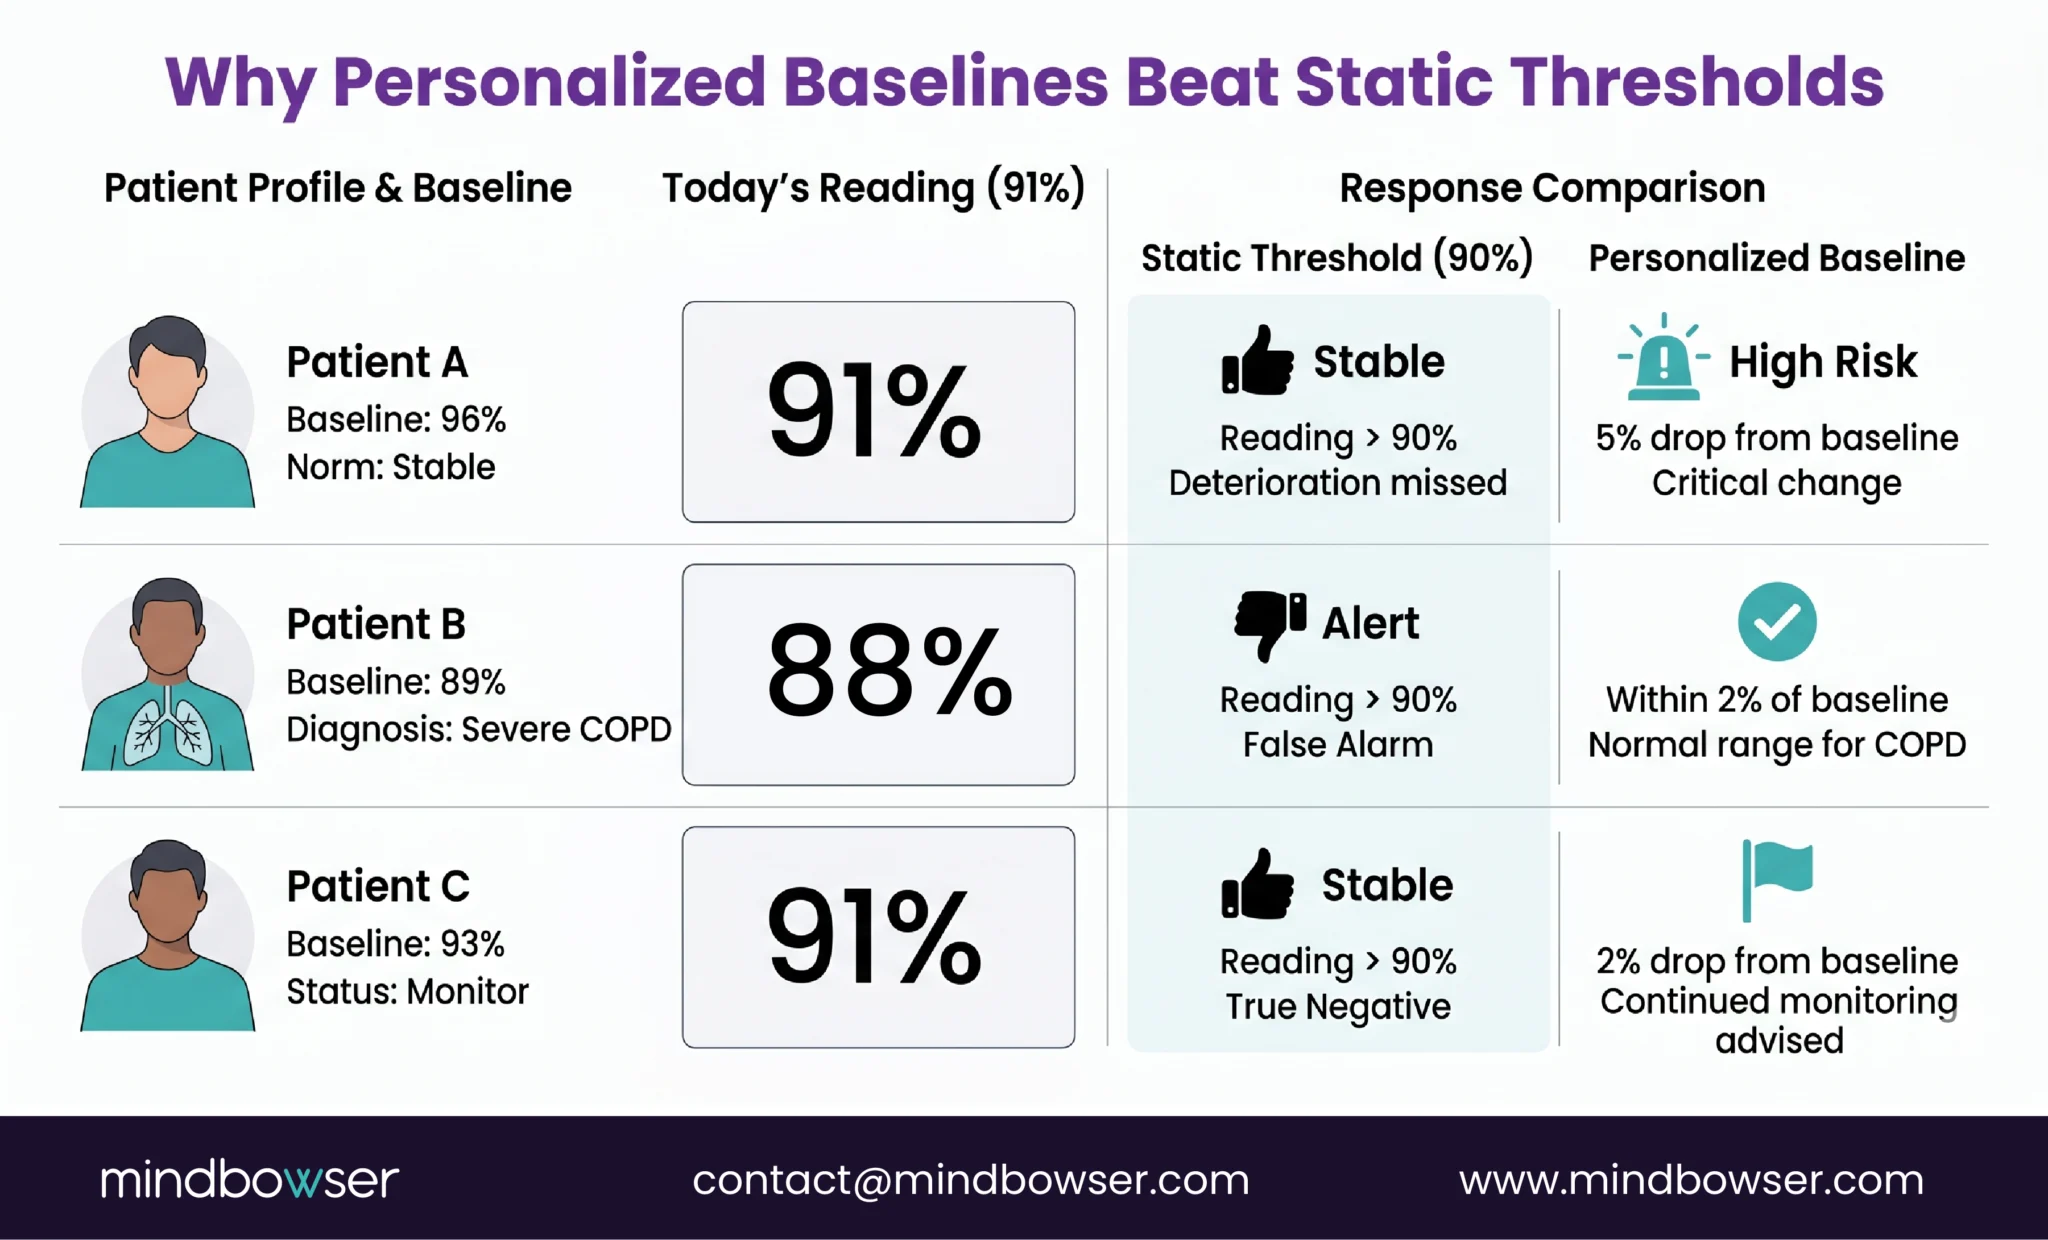
- Patient A: baseline SpO2 is 96%. A reading of 91% is a 5-point drop. High risk. Alert immediately.
- Patient B: baseline SpO2 is 89% (severe COPD). A reading of 91% is 2 points above baseline. Not alarming. No alert.
- Patient C: baseline SpO2 is 93%. A reading of 91% is a 2-point drop. Modest. Yellow flag for monitoring, not an immediate call.
Static threshold at 90% generates zero alerts for all three patients, including Patient A who is actually deteriorating. Static threshold at 92% generates an alert for Patient B every day (false alarm) while flagging Patients A and C equally despite dramatically different risk profiles.
Personalized baselines catch Patient A (real deterioration), ignore Patient B’s normal reading, and appropriately flag Patient C for monitoring. Three patients, three different responses to the same number. That is what clinical intelligence looks like.
Sandra Elliott at Hackensack Meridian Health presented this approach at BRI 2026. Her team’s AI predicts deterioration 24 to 48 hours before clinical events using personalized baselines. Her line: “Innovation without governance is just noise.” The prediction models work. The governance layer, the personalized baselines, the escalation logic, the care team training, is what makes them clinically useful.
How Does AI-Powered Alert Triage Actually Work?
The pipeline has five steps. Each one matters.
Step 1: Ingest. All device readings flow into the platform. SpO2, blood pressure, weight, glucose, activity levels, symptom questionnaire responses. Every data point, every timestamp, every device.
Step 2: Baseline comparison. Each new reading is compared against the patient’s 7 to 30 day rolling baseline. Not a population threshold. The patient’s own historical data. The system asks: “Is this reading unusual for this specific person?”
Step 3: Composite risk scoring. Single-vital alerts are the root of false alarm problems. Composite scoring combines multiple data streams. A SpO2 drop of 2% alone is a yellow flag. A SpO2 drop of 2% combined with a 3-pound weight gain and increased dyspnea on the symptom questionnaire is a red flag. The individual readings are ambiguous. The combination is not.
Step 4: Categorize. Green (stable, no action needed). Yellow (monitor, review at next scheduled check). Red (call today, potential deterioration). The categorization is based on the composite risk score, not on any single vital sign crossing a line.
Step 5: Route. Red alerts go to the care manager immediately. Yellow alerts queue for the next scheduled review. Green readings are logged but do not generate any notification. The care manager’s alert queue contains 30 to 40 actionable items instead of 400 undifferentiated ones.
A research team published an autonomous AI agent called Sentinel on arxiv in 2026 that achieved 95.8% emergency sensitivity and 88.5% sensitivity for all actionable alerts in RPM triage. Ninety-five point eight percent of true emergencies caught. That is better than most care teams achieve manually when they are processing 400 alerts per day.
RPMCheck AI implements this pattern: anomaly detection trained on individual patient data across vitals streams. Composite risk scoring. Tiered alert routing. The result across our deployments: 60 to 80% reduction in false alarms while the true positive detection rate stays the same or improves.
The honest caveat: AI triage is not a set-and-forget deployment. Patient conditions change. A patient who starts a new antihypertensive has a new blood pressure normal that takes 7 to 14 days to establish. Seasonal changes affect weight and activity patterns. The models need periodic retraining and the care team needs to flag when a patient’s clinical context shifts. Governance, as Elliott said, is not optional.
What Results Are Programs Seeing with Smart Triage?
The before-and-after numbers are the clearest way to illustrate this.
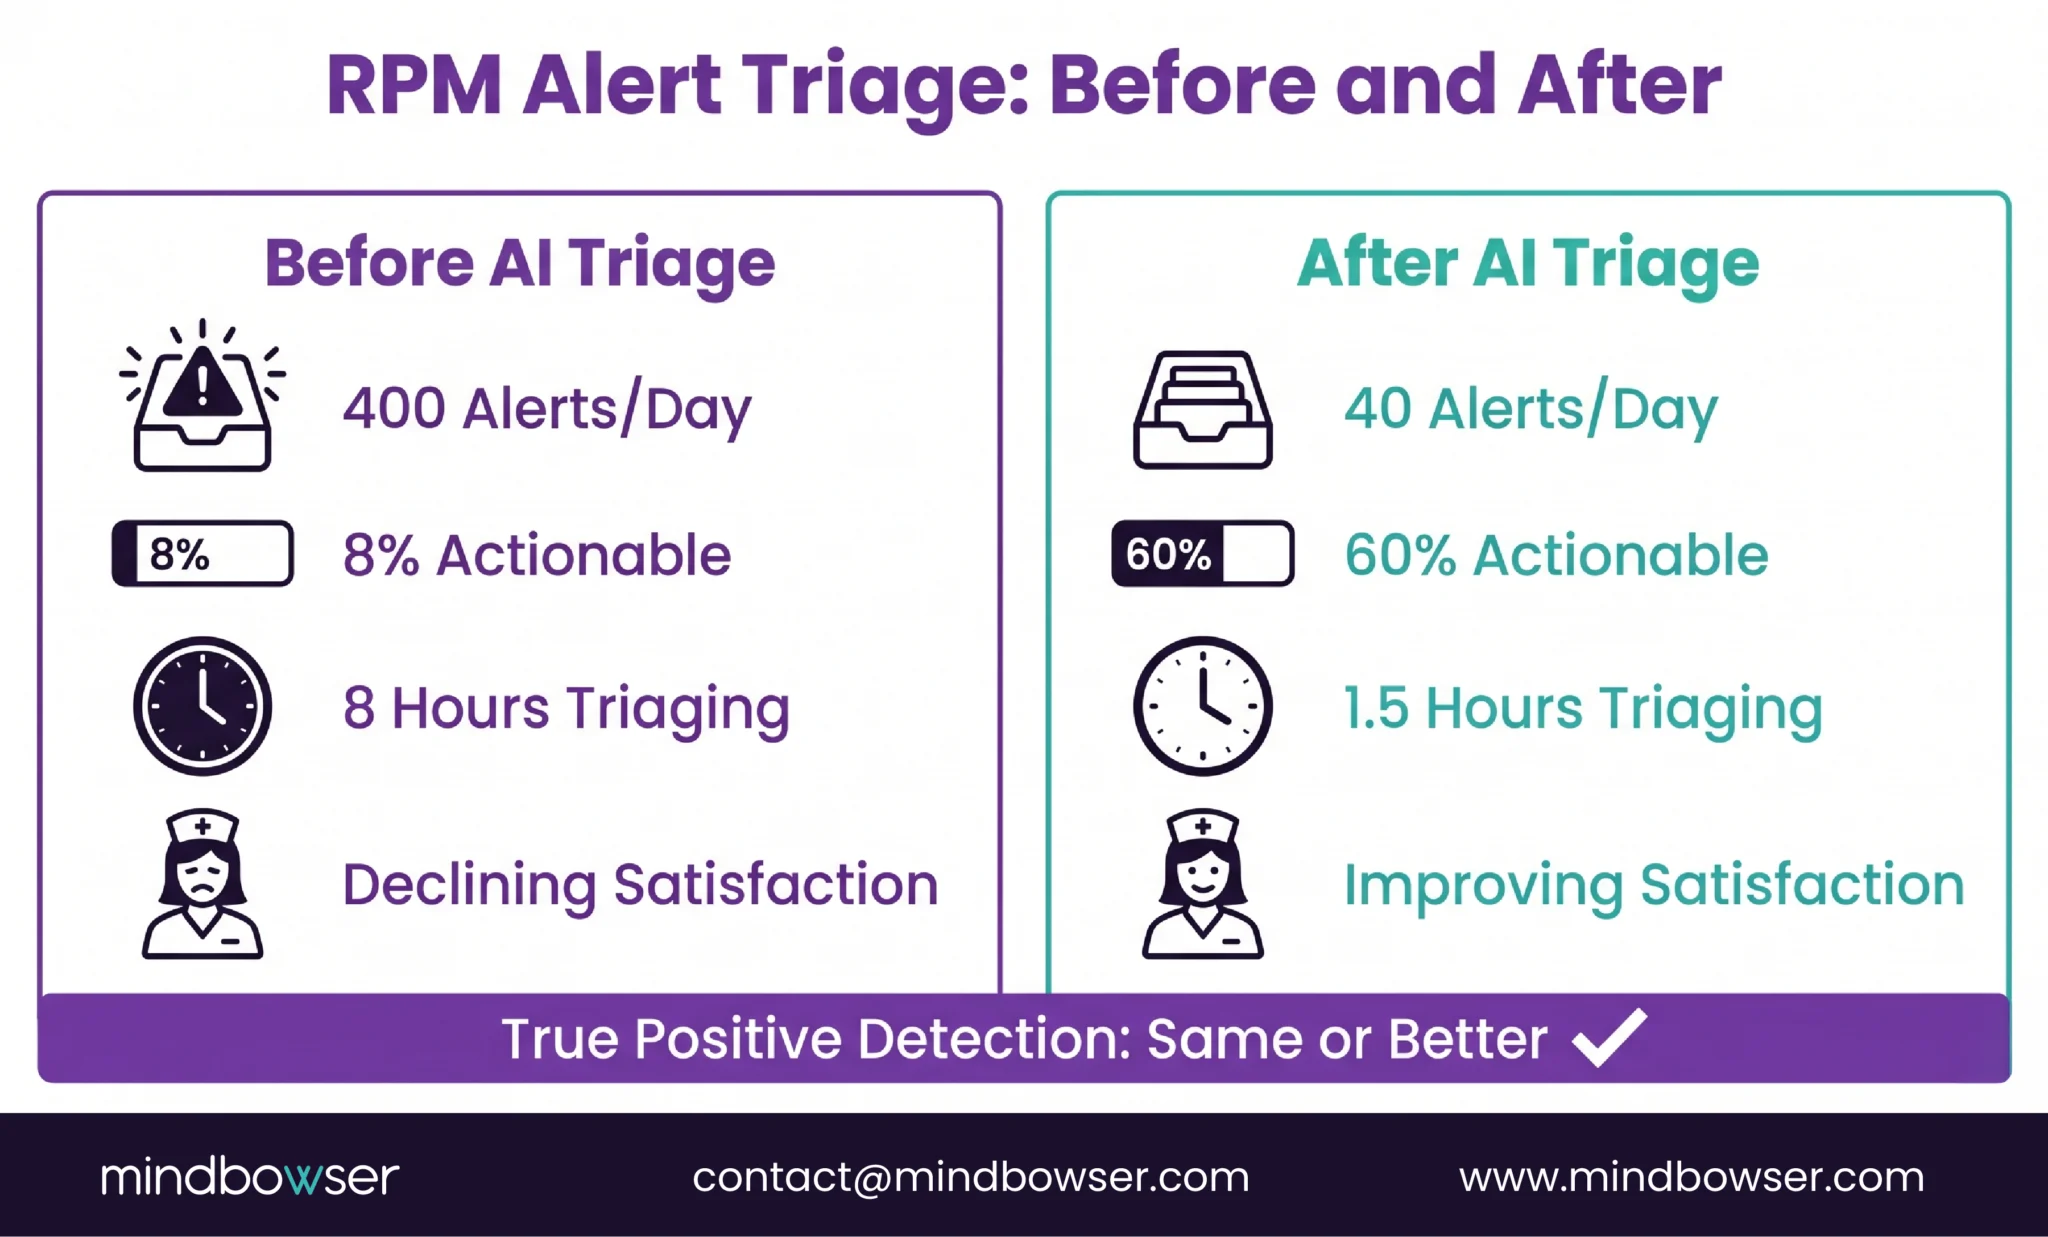
Before AI triage (typical 200-patient program):
- Daily alerts: 350-450
- Alerts requiring clinical action: 15-30 (4-8% of total)
- Care manager hours spent triaging: 6-8 per day
- True deterioration events caught: variable (some missed due to volume)
- Care team satisfaction: low and declining
After AI triage (same program, same patients):
- Daily alerts routed to care team: 30-50
- Alerts requiring clinical action: 20-35 (50-70% of routed alerts)
- Care manager hours spent triaging: 1-2 per day
- True deterioration events caught: same or higher (composite scoring catches patterns single-vital thresholds miss)
- Care team satisfaction: measurably improved
The counterintuitive finding: fewer total alerts but more true positive catches. The AI does not miss real deterioration. It filters out the noise that was masking it. A care manager reviewing 40 meaningful alerts with full clinical context makes better decisions than the same care manager reviewing 400 undifferentiated ones while exhausted.
An AI multi-device vitals platform we built reported a 45% increase in patient interaction after deploying intelligent monitoring. The care team spent less time on alert processing and more time on actual patient communication. The engagement metric went up because the administrative burden went down.
At BRI 2026, programs with AI-powered alert management reported care team retention improvements. Speeny’s presentation specifically tied workflow design (smart triage, appropriate alert routing, protected clinical time) to burnout reduction. The care teams stayed because the work felt clinical again, not clerical.
How Do You Fix Alert Fatigue in an Existing Program?
If your program is already running and alert fatigue is setting in, here are the six steps in order.
Step 1: Measure what you have. Most programs have never calculated their false alarm rate. Pull 7 days of alert data. Count total alerts. Count alerts that led to a clinical action (medication change, care plan update, patient call resulting in intervention). The ratio is your baseline. If fewer than 20% of alerts generate clinical action, you have an alert fatigue problem. Most programs I audit come in between 4% and 12%.
Step 2: Identify the noise generators. Which alert types produce the most false alarms? In our experience: weight alerts (daily fluctuation), single-vital SpO2 alerts (baseline variation in COPD patients), and blood pressure alerts (white coat effect from home monitoring anxiety) are the top three. Rank your alert types by false-alarm rate.
Step 3: Deploy patient-specific baselines. You need 14 to 30 days of data per patient before switching from static to personalized thresholds. During this learning period, run both systems in parallel: static alerts continue to fire (so nothing is missed), while the AI builds patient-specific baselines in the background.
Step 4: Implement tiered routing. Green (no notification, logged only). Yellow (queued for next scheduled review, typically within 24 hours). Red (immediate notification to care manager). The care team should only receive push notifications for red alerts. Yellow alerts wait in the queue for scheduled review blocks.
Step 5: Train the care team. This is the hardest step. Care teams who have been burned by false alarms for months do not immediately trust an AI system to filter correctly. The training needs to cover: what the AI does, how baselines are calculated, what the composite risk score means, and critically, how to override the AI when clinical judgment disagrees. The AI is a tool. The care manager remains the decision-maker.
Step 6: Monitor weekly. Track the alert-to-action ratio every week. Target: 40-60% of routed alerts should generate a clinical action. Below 20%: the system is still too noisy. Above 80%: the system might be filtering too aggressively and missing sub-acute deterioration. Adjust the sensitivity threshold based on weekly data.
For programs already using Mindbowser’s RPM platforms, RPMCheck AI can be deployed as a triage layer on top of existing alert infrastructure. The care manager workflow documentation covers the operational integration.
Alert Fatigue Is a Design Problem, Not a Volume Problem
Programs do not fail because they monitor too many patients. They fail because the monitoring architecture treats every patient the same. A 200-patient program with personalized baselines and AI triage is quieter, clinically sharper, and more sustainable than a 50-patient program running on static thresholds. The difference is not scale. It is design.
“Configure alerts for the patient, not for the device.” That is the one-line version. Every device comes with manufacturer-recommended alert thresholds. Those thresholds are designed for the broadest possible patient population. They are starting points, not clinical settings. The program that accepts the defaults and never calibrates is the program that generates 437 alerts per day and loses its best care manager.
Three years ago I told a client to just reduce the number of alert types. Fewer alerts would fix it, I said. Remove the yellow tier entirely. Only fire on reds. It did not work. The care team still got too many false alarms from the remaining alert types because the root cause was static thresholds, not alert volume. Volume reduction without intelligence is just a quieter version of the same problem. I learned that the hard way, and it cost that program three months of care team trust.
If your RPM program is drowning in alerts and you are worried the care team is about to stop looking, that is fixable. It is an architecture problem, not a people problem. Your care team is not the weak link. The alert system is.
Alert fatigue occurs when care teams receive so many RPM notifications that they become desensitized, leading to delayed responses, skipped reviews, and eventually missed deterioration events. In RPM specifically, it is caused by static threshold alerts generating high volumes of false alarms across patient panels. A 200-patient program on static thresholds can generate 300 to 500 alerts per day, of which 80-90% require no clinical action. The care team stops trusting the system, and the program fails operationally even though the technology works.
Published research shows false-positive rates of 80-90% in clinical monitoring environments (PMC scoping review, 2025). In RPM programs specifically, our experience and industry reports suggest 85-95% of alerts from static threshold systems generate no clinical action. The exact rate depends on the conditions monitored (COPD and diabetes programs tend to generate more false alarms than hypertension-only programs due to higher baseline variability) and whether the platform uses single-vital or composite alert logic.
AI reduces alert fatigue through three mechanisms: personalized baselines (learning what is normal for each patient instead of using population thresholds), composite risk scoring (combining multiple vital signs into a single risk assessment instead of alerting on each vital independently), and tiered routing (categorizing alerts into green/yellow/red and only pushing immediate notifications for red alerts). Research on the Sentinel AI agent (arxiv, 2026) demonstrated 95.8% emergency sensitivity with dramatically lower total alert volume. Our RPMCheck AI deployments show 60-80% false alarm reduction.
Personalized baseline monitoring uses machine learning to establish what is physiologically normal for each individual patient based on 14-30 days of their own data. Instead of alerting when a reading crosses a fixed population threshold (e.g., SpO2 below 90%), the system alerts when a reading deviates significantly from that patient’s personal pattern. A COPD patient with a baseline SpO2 of 89% would not trigger a false alarm at 90%, while a patient with a baseline of 96% would trigger a real alert at 91%. Same reading, different clinical meaning, different response.
Six to eight weeks from audit to live smart triage. Week 1: measure current alert volume and false alarm rate. Week 2: identify top noise-generating alert types. Weeks 3-5: deploy patient-specific baselines (requires 14-30 days of per-patient data to build). Week 6: implement tiered routing and train care team. Week 7+: monitor weekly alert-to-action ratios and adjust sensitivity. The longest step is baseline learning, which runs in the background while existing static alerts continue to fire.
Target: 40-60% of routed alerts should generate a clinical action (medication change, care plan update, patient call resulting in intervention). Below 20% means the system is still too noisy and the care team is processing excessive false alarms. Above 80% may indicate the system is filtering too aggressively and potentially missing sub-acute deterioration that warrants monitoring. Track this ratio weekly and adjust AI sensitivity thresholds based on the trend.