














 BLOGS
BLOGS  NEWSROOM
  CASE STUDIES
  WEBINARS
  PODCASTS
  ASSET HUB
  EVENT CALENDAR






















TL;DR
Epic Slicer Dicer is a self-service analytics tool built into the Epic EHR that allows clinicians, analysts, and hospital leaders to explore patient population data without relying on IT-generated reports. By enabling users to define cohorts, segment patient groups, and visualize trends through interactive charts, it helps healthcare organizations quickly analyze disease patterns, treatment outcomes, and operational metrics. Hospitals commonly use Epic Slicer Dicer for population health management, clinical research, and operational insights, making it a valuable tool for turning EHR data into faster, data-driven healthcare decisions.
“What happens when a clinician wants to analyze patient population trends but has to wait days for a report from the analytics team?”
Healthcare organizations collect massive amounts of clinical and operational data inside their EHR systems. However, turning that data into actionable insights quickly remains a challenge.
Epic Slicer Dicer addresses this gap by allowing clinicians, analysts, and hospital leaders to explore patient populations directly within the Epic environment through self-service analytics.
By enabling interactive cohort analysis and visual data exploration, the tool helps healthcare organizations uncover trends, improve operational visibility, and make faster data-driven decisions.
Healthcare organizations generate enormous amounts of data every day. Patient encounters, diagnoses, medications, lab results, and treatment outcomes are continuously captured within electronic health record systems.
Yet having data is not the same as having insight.
What happens when a clinician wants to analyze patient population trends but must wait days for an IT-generated report?
This challenge is common in hospitals where clinicians, researchers, and operational leaders depend on centralized reporting teams. A physician may want to examine treatment outcomes for a specific condition. A population health leader may want to analyze chronic disease trends. Hospital administrators may need insight into admission patterns or service line utilization.
Without accessible analytics tools, these questions often require custom reports that take time to produce.
“Healthcare organizations collect vast amounts of data inside their EHR systems, but turning that data into actionable insight often requires the right analytics tools.”
This is where the Epic Slicer Dicer becomes valuable.
Epic Slicer Dicer is a self-service data exploration and cohort analysis tool built into the Epic EHR platform. It allows clinicians, analysts, and healthcare leaders to explore patient populations through interactive queries and visualizations without relying on complex reporting workflows.
Understanding what Epic Slicer Dicer is and how to use It in Epic helps healthcare organizations turn EHR data into faster, data-driven decisions.
I. What is Epic Slicer Dicer?
A. Epic Slicer Dicer — Self-Service Analytics Inside the Epic EHR
Epic Slicer Dicer is a self-service data exploration tool built directly into the Epic electronic health record system. It allows clinicians, analysts, and hospital leaders to analyze patient population data without needing specialized reporting tools or database queries.
If someone asks what an Epic Slicer Dicer is, the simplest explanation is that it is an interactive analytics tool within Epic that enables users to explore patient data through filters, segmentation, and visualizations.
Instead of requesting static reports from IT teams, users can define patient populations and immediately explore trends. Because Epic Slicer Dicer operates within Epic Hyperspace, the analysis occurs in the same environment that clinicians use for documentation and patient chart review.
Hospitals frequently use Epic Slicer Dicer to investigate questions such as which patient groups have higher readmission rates, how treatment outcomes vary by demographics, and how disease patterns change over time.
This ability to explore data directly inside the EHR makes the tool particularly valuable for healthcare teams that need fast answers to clinical and operational questions.
B. Population Cohort Analysis
At its core, Epic Slicer Dicer is designed for cohort analysis. A cohort is a group of patients who share certain characteristics such as diagnoses, procedures, demographics, or care settings.
Healthcare organizations often analyze cohorts to understand disease prevalence, treatment effectiveness, and care utilization.
Using Epic Slicer Dicer, clinicians and analysts can define patient populations based on criteria like diagnosis codes, procedures performed, or encounter types. Once the cohort is defined, users can explore how that population varies across different variables.
For example, a hospital may analyze diabetic patients and examine how the population is distributed across age groups or clinics. Researchers may explore cohorts of patients diagnosed with a specific condition to study trends over time.
This capability allows healthcare teams to investigate population patterns quickly without requiring complex data extraction.
C. Interactive Data Visualization
Another important feature of Epic Slicer Dicer is its use of visual analytics. Rather than presenting results in spreadsheets, the tool displays insights as charts and graphs, making patterns easier to interpret.
Users can view patient population data through visualizations such as:
- Bar charts comparing patient groups
- Line graphs showing trends over time
- Tree maps illustrating population distribution
- Cohort comparisons across variables
These visualizations help clinicians and healthcare leaders quickly identify patterns within large datasets.
Because the insights appear directly within Epic, users can move seamlessly between population-level analysis and individual patient records when deeper investigation is required.
Understanding how to use Epic Slicer Dicer in Epic enables healthcare teams to transform EHR data into actionable insights that support clinical research, population health management, and operational decision-making.
II. Why Hospitals Use Epic Slicer Dicer
A. The Challenge of Accessing Healthcare Data
Healthcare organizations capture enormous amounts of clinical and operational data through their EHR systems. Diagnoses, medications, procedures, and encounter histories provide valuable insight into how care is delivered across patient populations.
However, accessing this information quickly has historically been difficult.
Many hospitals rely on centralized analytics teams to generate reports. When clinicians or administrators need answers, they often submit data requests that must be extracted from complex databases and formatted into reports.
This process can take days or weeks.
As a result, important questions about patient populations, care outcomes, or operational performance may remain unanswered when decisions need to be made.
This is where Epic Slicer Dicer helps healthcare organizations move faster.
Instead of waiting for reports, users can explore patient population data directly within Epic. Clinicians and analysts can define cohorts, apply filters, and visualize trends immediately.
By enabling faster access to insights, Epic Slicer Dicer supports more responsive clinical and operational decision-making.
B. Enabling Self-Service Analytics for Healthcare Teams
Modern healthcare organizations increasingly depend on data-driven decision-making. Clinical departments, research teams, and hospital leadership all require insight into patient populations and care patterns.
It enables self-service analytics, allowing these teams to explore data independently.
For example, a clinical department may want to analyze patients diagnosed with hypertension over the past year. Using the Epic Slicer Dicer, they can quickly examine how those patients are distributed across age groups, care locations, or treatment pathways.
Population health teams can use the tool to monitor chronic disease trends and identify high-risk patient groups.
Understanding how to use Epic Slicer Dicer in Epic EHR lets healthcare teams investigate questions quickly without relying on specialized reporting resources.
C. Stakeholders Who Commonly Use Epic Slicer Dicer
Because of its accessibility, the Epic Slicer Dicer is used by a wide range of stakeholders within healthcare organizations.
Clinicians use the tool to analyze treatment outcomes and patient populations associated with specific conditions.
Population health leaders rely on it to identify high-risk groups and monitor chronic disease management.
Clinical researchers explore patient cohorts to support study design and hypothesis generation.
Hospital operations teams analyze metrics such as patient volume, admission patterns, and service line performance.
Across these groups, the goal is consistent: turning EHR data into actionable insight that supports better care delivery and operational planning.
III. How Epic Slicer Dicer Works
A. Step 1 — Defining the Patient Population
The first step in using Epic Slicer Dicer is defining the patient population to analyze. In healthcare analytics, this population is often referred to as a cohort.
Users begin by selecting criteria that determine which patients are included in the dataset. These filters allow clinicians and analysts to focus only on the relevant patient group.
Common criteria include diagnoses, demographic attributes, procedures performed, encounter types, or care locations. For example, a hospital might define a cohort of patients diagnosed with asthma within the past two years across outpatient clinics.
This process establishes the foundation of the analysis. Once the cohort is defined, users can begin exploring patterns within that population.
B. Step 2 — Slicing the Data Across Key Variables
After defining the patient population, the next step is to segment the data. This is where the name Epic Slicer Dicer comes from.
Users “slice” the population into smaller groups based on variables such as age, gender, diagnosis category, insurance type, or visit location. Segmenting the data helps healthcare teams identify patterns that may not appear when viewing the entire population.
For example, a hospital analyzing asthma patients may discover that emergency department visits are concentrated among younger age groups. This insight could prompt targeted preventive care initiatives.
By enabling flexible segmentation, Epic Slicer Dicer helps clinicians and analysts quickly explore relationships within patient populations.
C. Step 3 — Visualizing and Interpreting Results
Once the data has been segmented, results are displayed as visual charts, making trends easier to interpret.
Users can view population data using bar charts, line graphs, or other visual formats to highlight patterns over time or across patient groups. These visualizations help healthcare teams quickly identify shifts in disease prevalence, treatment outcomes, or care utilization.
Because the analysis occurs within Epic, users can move from population-level insights to individual patient records when deeper investigation is needed.
Through this workflow of cohort definition, segmentation, and visualization, Epic Slicer Dicer allows healthcare organizations to transform raw EHR data into practical insights that support clinical, research, and operational decisions.
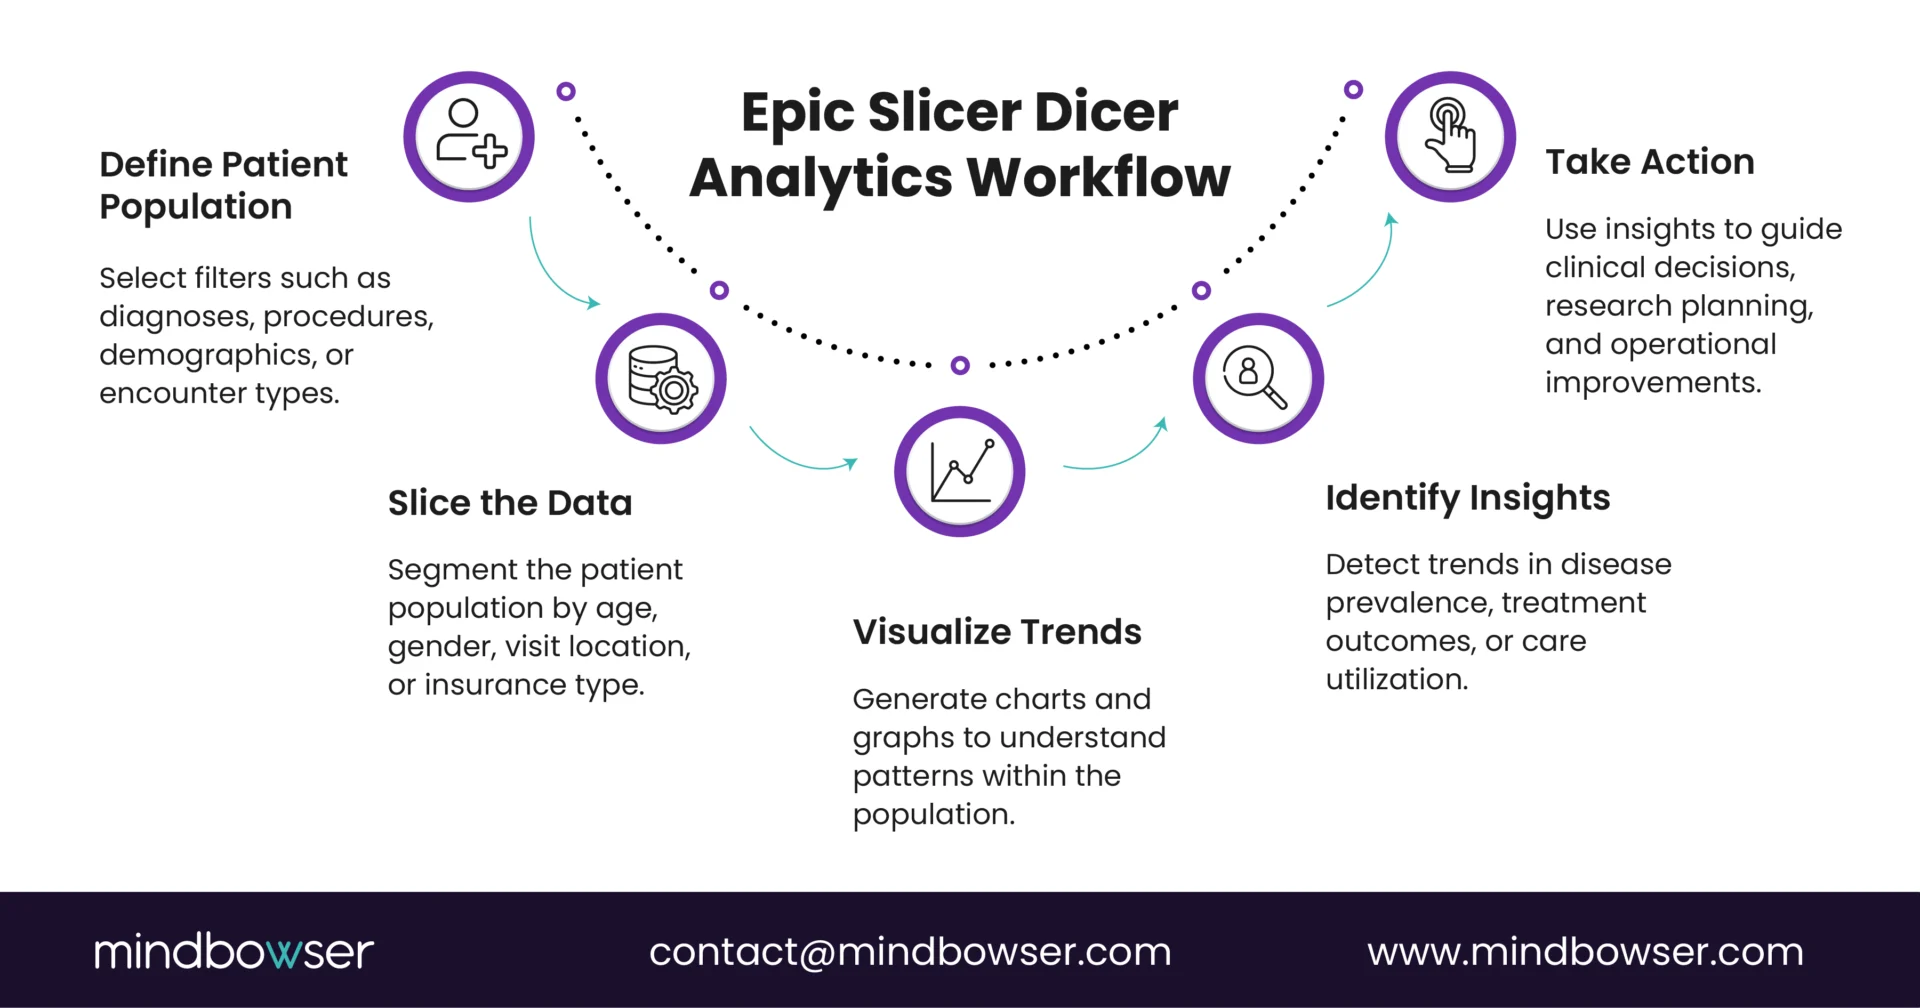
IV. How to Use Epic Slicer Dicer: A Step-by-Step Tutorial
- Open Epic Slicer Dicer in Hyperspace through the Analytics Catalog or the Slicer Dicer toolbar icon.
- Select a starting population, such as patients, encounters, or diagnoses.
- Apply filters, including date range, diagnosis code, department, provider, or other configured dimensions.
- Add a measure, such as patient count, rate, average length of stay, or another metric available in your Epic environment.
- Choose a visualization, such as a bar chart, trend line, or pivot table, using the display-options panel.
- Save the query as a saved filter for recurring analysis, or share it with colleagues through Slicer Dicer’s sharing controls.
Epic also provides formal Slicer Dicer training and certification through its learning portal. This guide covers the core analytical workflow most users can begin with inside their organization’s configured Epic environment.
V. Key Features of Epic Slicer Dicer
A. Self-Service Analytics
What happens when a department chair wants to quickly understand how many patients with heart failure were treated across different clinics last year?
In many hospitals, answering that question would normally require submitting a request to the analytics team and waiting for a report. Epic Slicer Dicer changes that workflow by enabling self-service analytics directly inside the Epic environment.
Clinicians, researchers, and operational leaders can define patient populations and explore the data themselves without writing queries or relying on specialized reporting tools. By applying filters and adjusting variables, users can interactively explore patient populations in real time.
This capability significantly reduces reporting delays and allows healthcare teams to investigate clinical questions immediately.
B. Population Cohort Analysis
Imagine a population health manager trying to understand which patients with diabetes have not completed recommended screenings in the past year.
With Epic Slicer Dicer, analysts can define a cohort of diabetic patients and examine how that population varies across age groups, care locations, or treatment histories.
Cohort analysis enables healthcare organizations to examine patient groups with specific characteristics. Diagnoses, procedures, demographics, or encounter types may define these groups.
This functionality makes Epic Slicer Dicer particularly valuable for population health initiatives and clinical research, where understanding patterns across patient groups is essential.
C. Trend Analysis
What if a hospital wants to understand whether emergency department visits related to respiratory illness are increasing year over year?
Trend analysis allows healthcare teams to examine changes in patient populations across time.
By viewing data across months or years, clinicians and hospital leaders can identify patterns in disease prevalence, treatment utilization, or hospital admissions. These insights help organizations anticipate demand and evaluate the impact of care programs.
Trend analysis also supports long-term strategic planning by highlighting shifts in patient populations and healthcare utilization.
D. Visual Data Exploration
When clinicians review large datasets, interpreting the information quickly can be challenging.
What if a cardiology team wants to compare outcomes across several patient groups but needs a clear way to visualize those differences?
It addresses this challenge by presenting results through visual charts and graphs rather than static tables.
Users can explore population data through bar charts, line graphs, and other visual displays that highlight trends and comparisons. Visualization makes complex datasets easier to interpret and helps clinicians quickly identify meaningful patterns.
E. Drill-Down Analytics
Sometimes population trends raise new questions.
For example, what if hospital leaders discover that readmissions for a particular condition have increased during the past quarter?
Using the Epic Slicer Dicer, analysts can drill deeper into the data by examining specific subgroups within the larger patient population. They may explore differences across demographics, care locations, or treatment histories to understand what is driving the trend.
This ability to move from high-level population insights to more detailed analysis allows healthcare organizations to investigate problems more effectively and identify potential improvement opportunities.
Build a Custom EHR with Epic Integration Capabilities
VI. Real-World Use Cases of Epic Slicer Dicer
A. Clinical Research and Disease Pattern Exploration
Imagine a clinical research team investigating Lyme disease trends within a regional health system.
Instead of manually reviewing records or requesting multiple reports, researchers can use Epic Slicer Dicer to quickly identify patients diagnosed with Lyme disease over several years. Once the cohort is defined, they can explore how cases vary across months, geographic regions, or age groups.
This type of exploration helps researchers detect seasonal patterns or demographic clusters that may guide further investigation.
For many healthcare organizations, Epic Slicer Dicer acts as an early-stage research discovery tool. It allows investigators to explore potential patient cohorts and identify trends before launching formal research studies or clinical trials.
B. Population Health Management
Consider a population health team responsible for managing chronic disease outcomes across a large patient population.
What if they want to identify diabetic patients who have not completed recommended HbA1c tests during the past year?
Using Epic Slicer, analysts can define a cohort of patients with diabetes and then segment the population by screening compliance, age group, or care location.
This analysis helps population health leaders quickly identify care gaps. Once those gaps are identified, targeted outreach programs can be designed to improve adherence to preventive care.
In this way, Epic Slicer Dicer supports proactive care management by helping healthcare organizations identify patients who may benefit from additional intervention.
C. Hospital Operations and Resource Planning
Operational leaders frequently need to understand how patient demand is changing across departments.
What if a hospital notices that emergency department volumes appear to be rising but wants to confirm the trend before adjusting staffing levels?
Using the Epic Slicer Dicer, administrators can analyze admission and visit patterns across different time periods. They may examine patient volumes by month, by department, or by care location.
This type of operational analysis helps hospitals anticipate demand, allocate resources more effectively, and identify areas where capacity may need to expand.
Because these insights can be generated quickly, operational leaders can respond to emerging trends without waiting for complex reporting cycles.
D. Clinical Trial Recruitment
Recruiting patients for clinical trials is often one of the most difficult stages of research.
Imagine a research team preparing a cardiovascular study that requires patients with specific diagnoses, treatment histories, and demographic characteristics.
Using the Epic Slicer Dicer, researchers can explore the EHR to estimate how many patients meet the initial eligibility criteria. They can analyze patient populations by diagnosis, procedure history, or age group to determine whether sufficient candidates exist for the trial.
This early analysis allows research teams to assess feasibility before launching a full recruitment effort.
For many organizations, Epic Slicer Dicer serves as a bridge between clinical care data and research planning, helping investigators identify patient populations more efficiently.
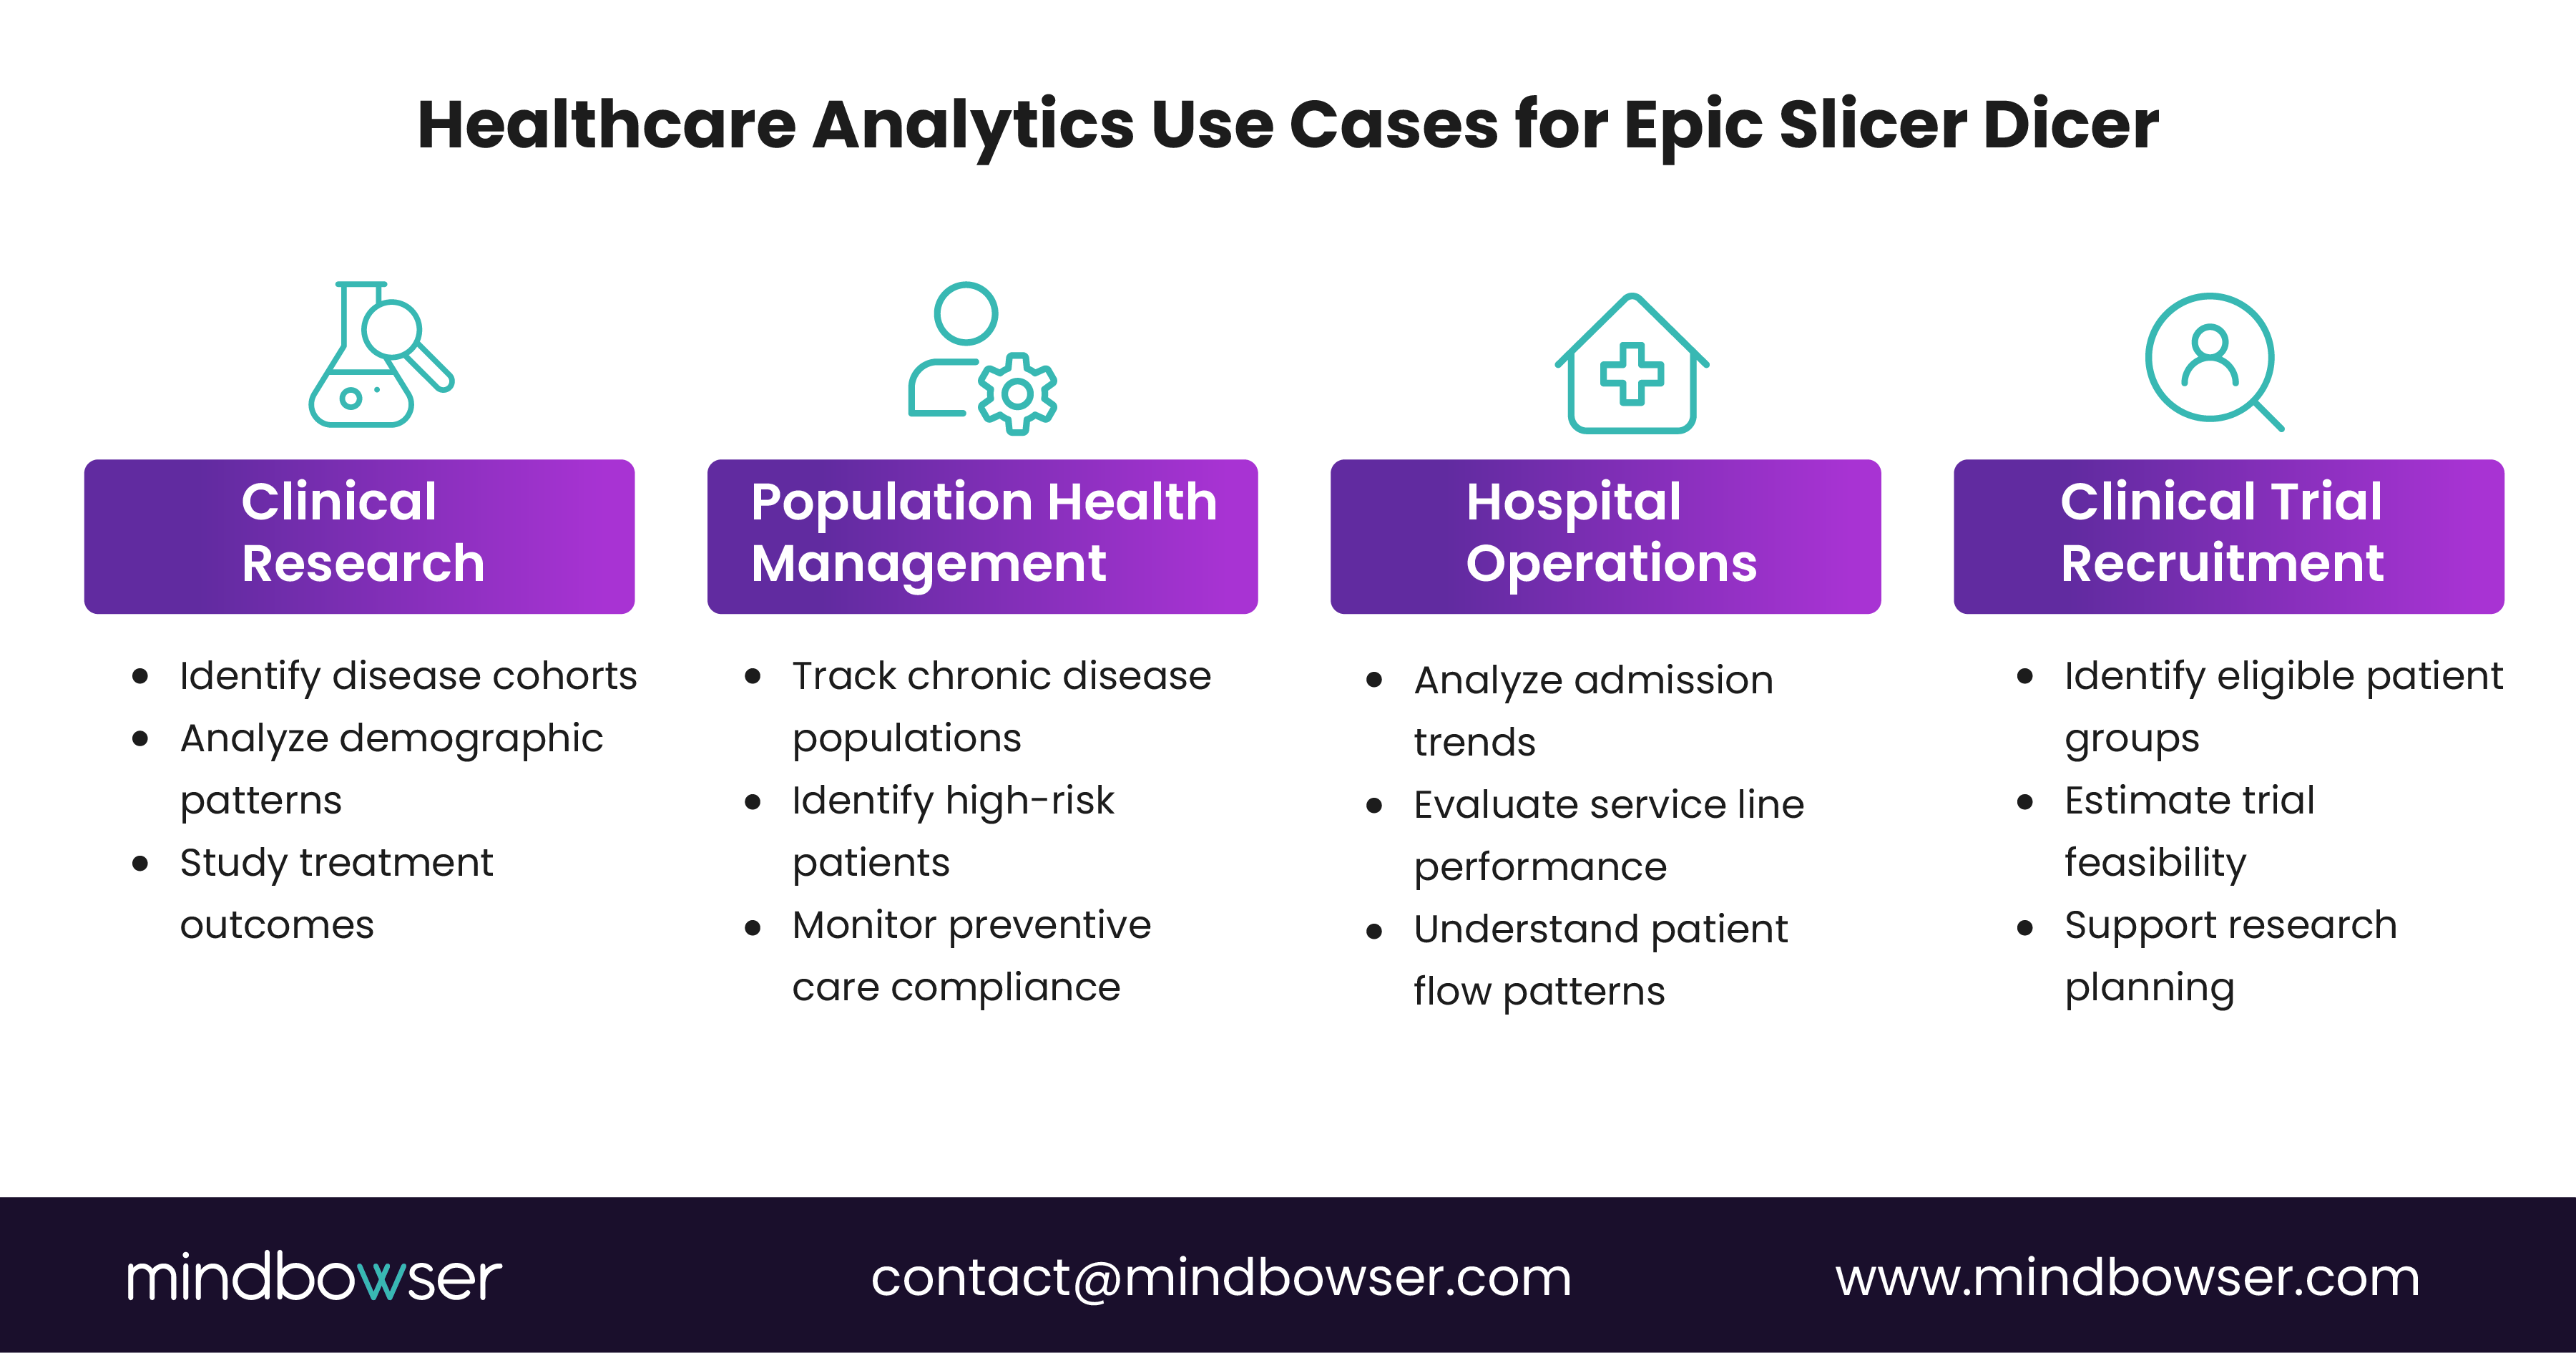
VII. Benefits of Epic Slicer Dicer for Healthcare Organizations
A. Faster Access to Clinical and Operational Insights
What happens when a care team wants to quickly understand how many patients with a certain condition were admitted during the past quarter?
In many hospitals, this type of question requires submitting a report request and waiting for analysts to retrieve the data. With Epic Slicer Dicer, clinicians and hospital leaders can explore the information themselves.
By defining a patient cohort and applying filters, users can generate insights within minutes. This speed allows healthcare teams to respond quickly to emerging trends in patient populations, disease prevalence, or hospital utilization.
Faster access to insights means decisions can be based on current data rather than delayed reports.
B. Improved Patient Care Through Data-Driven Decisions
Imagine a clinical department reviewing treatment outcomes for patients with heart failure.
Instead of examining individual cases one by one, clinicians can use Epic Slicer Dicer to analyze patterns across the entire patient population. They can compare outcomes across age groups, care settings, or treatment approaches.
These insights help care teams understand which interventions appear most effective and where care pathways may need improvement.
By supporting population-level analysis, Epic Slicer Dicer helps clinicians move beyond isolated patient encounters and identify broader opportunities to improve care quality.
C. Greater Operational Efficiency
Hospital administrators constantly manage resources such as staffing, bed capacity, and clinical services.
What if leaders want to understand whether patient admissions are increasing within a particular department?
Using the Epic Slicer Dicer, operational teams can quickly analyze trends in admissions, discharges, or patient volumes. This information helps hospitals anticipate demand and allocate resources more effectively.
Operational analytics generated through the tool can also reveal workflow inefficiencies or patterns that affect hospital performance.
D. Stronger Research and Population Health Capabilities
Healthcare organizations increasingly rely on data to support clinical research and population health initiatives.
For example, a research team may want to identify patients with a specific condition who meet certain demographic criteria. A population health program may need to monitor chronic disease trends across a community.
Epic slicer dicer enables both of these activities by making patient population analysis easier and faster.
Researchers can explore potential study cohorts, while population health teams can track preventive care metrics and identify high-risk patient groups.
These capabilities help healthcare organizations translate EHR data into insights that support research, public health programs, and long-term care improvement.
VIII. Limitations and Challenges of Epic Slicer Dicer
A. Data Governance and Access Controls
What if a hospital analyst wants to explore patient data across multiple departments, but certain datasets contain sensitive information?
Healthcare data is tightly regulated, and access must follow strict governance policies. While Epic Slicer Dicer makes data exploration easier, organizations must still control who can access specific data elements.
Hospitals typically configure user permissions so that clinicians, analysts, and administrators only view the data necessary for their roles. These safeguards help protect patient privacy and maintain compliance with healthcare regulations.
As a result, some analyses may be limited depending on access permissions or institutional policies.
B. Training and Data Interpretation
Although Epic Slicer Dicer is designed for self-service analytics, users still need a basic understanding of healthcare data and cohort analysis.
For example, what if a user defines a patient cohort incorrectly or misinterprets the meaning of a data filter?
Without proper training, analysts or clinicians might draw inaccurate conclusions from the data. Many healthcare organizations, therefore, provide training sessions to help staff learn how to define cohorts, apply filters correctly, and interpret visualizations.
Proper training ensures that insights generated through Epic Slicer Dicer support informed decision-making rather than confusion.
C. Limited Advanced Analytics Capabilities
Epic slicer dicer is primarily designed for exploratory analytics rather than advanced data science.
Imagine a hospital data science team trying to build predictive models for patient readmission risk. While Epic Slicer Dicer can help identify patient populations and explore trends, advanced statistical modeling typically requires external analytics platforms.
For this reason, many organizations use Epic Slicer Dicer as an initial discovery tool before performing deeper analysis in enterprise data warehouses or analytics platforms.
D. Need for Integration with Broader Analytics Ecosystems
Most healthcare systems operate within a broader analytics ecosystem that includes business intelligence tools, population health platforms, and data warehouses.
For example, a health system may want to combine Epic clinical data with claims data or remote patient monitoring data. These types of cross-platform analyses usually occur outside the EHR.
While Epic Slicer Dicer is powerful for exploring Epic data directly, it often works best as part of a larger analytics strategy that includes external data platforms and enterprise reporting systems.
IX. Epic Slicer Dicer vs Traditional Healthcare Reporting Tools
A. Ease of Use and Accessibility
What happens when a clinician needs a quick answer but the only option is a complex reporting tool built for data analysts?
Traditional healthcare reporting systems often require technical expertise. Analysts may need to write queries, navigate complex data models, or build dashboards before results can be generated.
Epic slicer dicer simplifies this process by providing an interface designed for clinicians and operational leaders. Users can define patient populations, apply filters, and explore data without needing advanced analytics skills.
This accessibility allows more healthcare professionals to interact directly with EHR data rather than relying entirely on specialized reporting teams.
B. Speed of Analytics and Reporting
Traditional reporting workflows typically follow a request-and-response model. A department submits a report request, analysts prepare the dataset, and the final report is delivered later.
What if hospital leaders need to understand patient trends today rather than next week?
With the Epic Slicer Dicer, users can explore data immediately. By adjusting filters and cohort definitions, clinicians and analysts can test multiple questions during a single session.
This interactive workflow allows healthcare teams to generate insights much faster than traditional reporting processes.
C. Visualization and Data Exploration
Many traditional healthcare reports present information through static tables or spreadsheet-style outputs.
While these reports contain useful data, interpreting them can be time-consuming.
This introduces interactive visualizations that make population trends easier to understand. Charts and graphical views highlight patterns in patient populations, treatment outcomes, and care utilization.
These visual tools help clinicians and operational leaders quickly identify trends without manually interpreting large datasets.
D. Scope of Analysis and Reporting Depth
Traditional reporting systems are often designed to produce standardized reports such as financial summaries, operational metrics, or regulatory compliance reports.
These reports are useful but typically answer predefined questions.
In contrast, Epic Slicer Dicer supports exploratory analytics. Users can investigate new questions by adjusting filters, redefining cohorts, or examining different variables within the dataset.
This flexibility allows healthcare organizations to move beyond static reporting and develop a more interactive approach to healthcare analytics.
X. Epic’s AI Evolution — The Slicer Dicer Sidekick
A. Moving from Manual Queries to Conversational Analytics
What if a clinician could simply ask a question and receive an instant population analysis?
Epic has been expanding its analytics capabilities by introducing AI-assisted features that make data exploration even easier. One emerging concept within this evolution is the Slicer Dicer Sidekick, which builds on the foundation of Epic Slicer Dicer.
Instead of manually applying filters and defining cohorts, users may eventually be able to describe what they want to analyze using natural language. For example, a clinician might ask a question such as:
How many patients over age 65 with heart failure were admitted in the past six months?
AI-assisted tools can translate these questions into cohort queries and automatically generate visual insights. This approach reduces the time required to explore patient populations and makes analytics even more accessible for clinicians.
B. Automated Cohort Identification
Imagine a clinical research team trying to identify patients who meet several complex eligibility criteria for a study.
Traditionally, analysts must manually define the cohort and apply multiple filters within Epic Slicer Dicer. AI-assisted analytics tools can simplify this process by automatically identifying relevant patient groups based on clinical criteria.
These systems analyze structured data within the EHR to identify patients who match specific characteristics such as diagnoses, treatments, or demographic attributes.
By accelerating cohort discovery, AI-assisted analytics tools help researchers and population health teams work more efficiently.
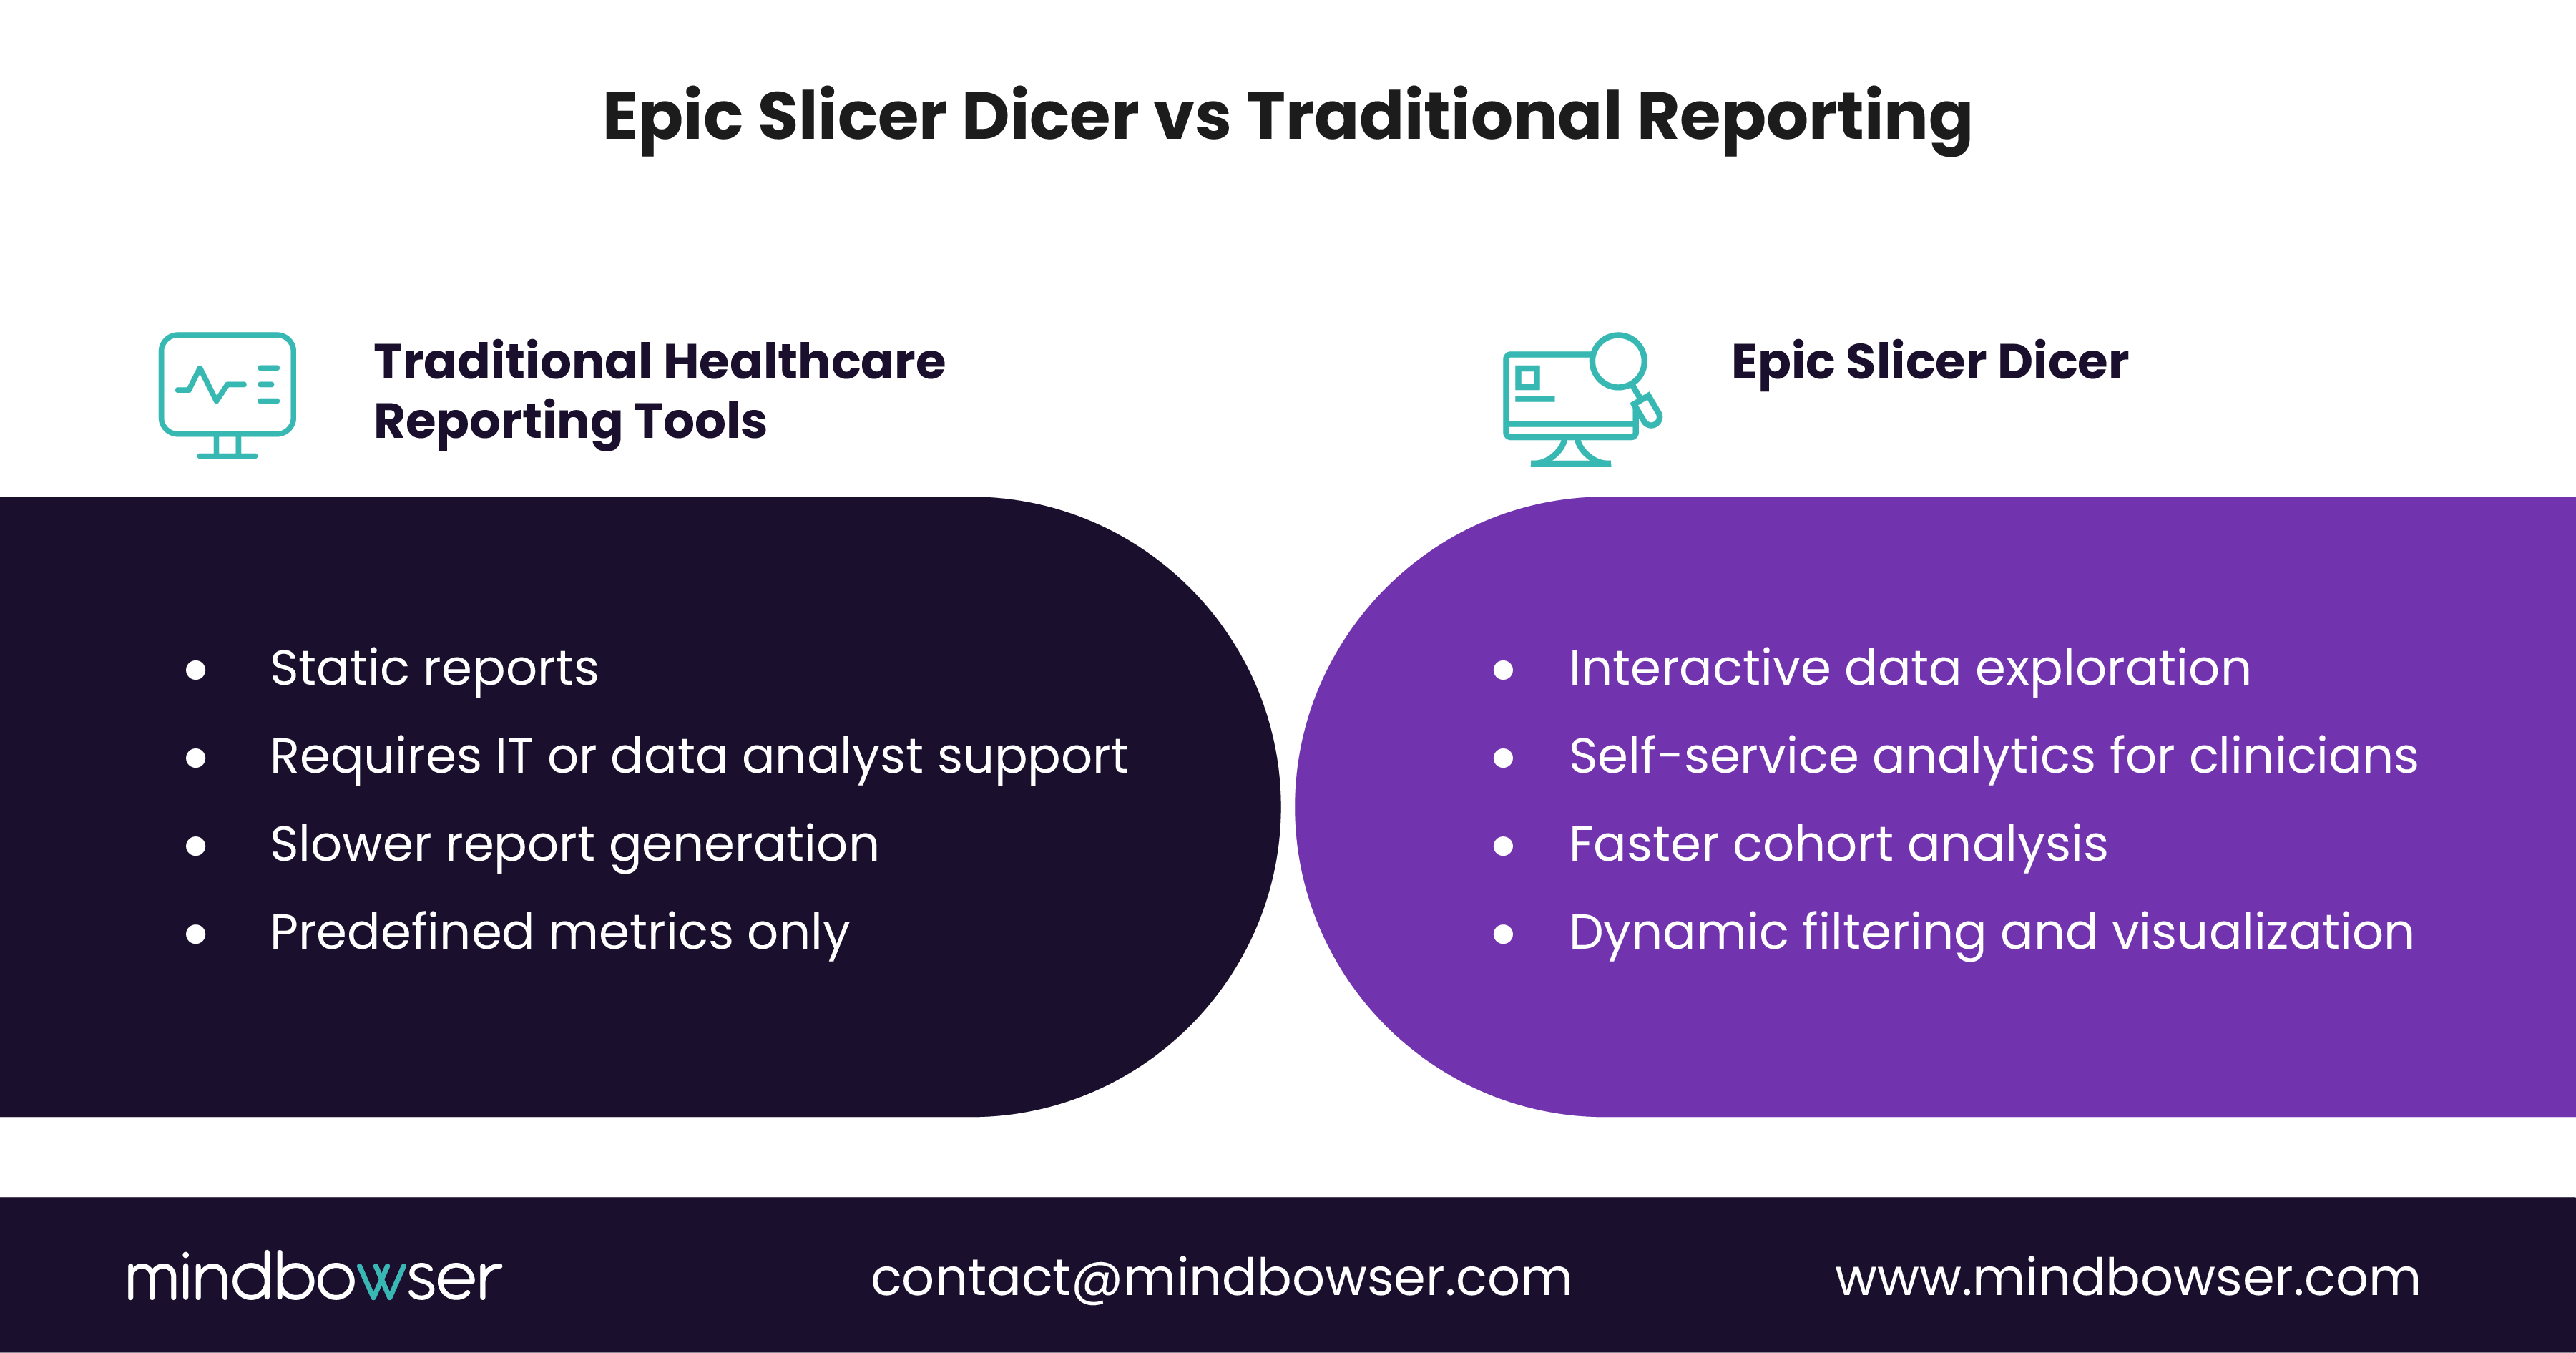
C. AI-Powered Care Gap Detection
Another potential application of AI within Epic analytics is identifying care gaps across patient populations.
What if a healthcare system could automatically identify patients who have missed recommended screenings or follow-up visits?
By analyzing patient data at scale, AI-driven tools can highlight populations that may require intervention. For example, the system might identify diabetic patients who have not completed annual HbA1c testing or patients overdue for preventive screenings.
When combined with the Epic Slicer-Dicer, these capabilities enable healthcare organizations to move from simple data exploration to proactive care management.
D. Expanding the Role of EHR Analytics
As AI capabilities evolve, EHR analytics tools are gradually becoming more intelligent and proactive.
Rather than simply displaying historical data, systems like Epic Slicer Dicer may increasingly support predictive insights, automated alerts, and conversational data exploration.
For healthcare organizations focused on population health, clinical research, and operational planning, this shift represents an important step toward more advanced healthcare intelligence platforms.
XI. Taking Slicer Dicer Data Beyond Epic
Slicer Dicer explores Epic data inside Epic. To pull those cohorts into your own population-health application or AI model, you integrate through Epic’s FHIR APIs.
ConnectHealth provides that Epic connection in days, runs inside your AWS VPC, and uses Helix AI to build the required data workflows.
See the full Epic modules library.
When Should Hospitals Use Epic Slicer Dicer?
Epic Slicer Dicer helps healthcare organizations turn the vast data stored in Epic EHR systems into practical insight. By enabling clinicians, analysts, and hospital leaders to explore patient populations through self-service analytics, the tool supports faster understanding of disease trends, treatment outcomes, and operational performance. When used alongside broader analytics platforms and emerging AI capabilities, Epic Slicer Dicer becomes a powerful foundation for data-driven healthcare decision-making across research, population health, and hospital operations.
Epic Slicer Dicer is a self-service analytics tool within the Epic EHR that allows clinicians and analysts to explore patient population data through cohort analysis and interactive visualizations.
Users define a patient population using filters such as diagnoses, demographics, procedures, or encounter types. The tool then allows users to segment and visualize the data to identify patterns across the population.
Common users include clinicians, population health leaders, clinical researchers, healthcare analysts, and hospital operations teams.
The tool enables faster data exploration, supports population health analysis, helps researchers identify cohorts, and provides operational insights for hospital leadership.
Epic Slicer Dicer is best used for exploratory analytics and cohort analysis. Many healthcare organizations still use enterprise reporting platforms for advanced analytics and large-scale reporting.
Open Slicer Dicer through the Analytics Catalog in Epic Hyperspace. Select a population, such as patients, encounters, or diagnoses; apply filters such as date range, diagnosis, or department; add a measure; and choose a visualization. You can then save the result as a filter or share it with colleagues.
Epic Slicer Dicer is designed for fast, exploratory cohort analysis. It is visual, self-service, and does not require SQL.
Reporting Workbench is designed for structured, repeatable reports built from predefined templates.
Use Slicer Dicer to investigate a question. Use Reporting Workbench to turn an established reporting need into a repeatable operational report.
Slicer Dicer Sidekick is Epic’s AI-assisted layer for Slicer Dicer. It lets users describe a clinical or analytical question in plain language and converts that request into a Slicer Dicer query, reducing the time required to configure a cohort analysis.
Yes. From the results view, use the export control to download the data as a CSV file, which can be opened in Excel.
Export availability and cohort-size limits may depend on your organization’s Epic configuration and user permissions. If the export option is unavailable, contact your Epic analytics or security team.