BLOGS
BLOGS  NEWSROOM
  CASE STUDIES
  WEBINARS
  PODCASTS
  ASSET HUB
  EVENT CALENDAR


TL;DR
Critical Access Hospitals receive 101% of allowable costs on Medicare services under cost-based reimbursement, yet the average CAH all-payer profit runs only $1 to $2 million per year per MedPAC’s 2024 analysis , thin enough that CHQPR estimates 760 rural hospitals (one-third of the rural total) are currently at risk of closing. The paradox is explained by three mechanics: cost-based reimbursement covers Medicare operating costs but not capital investment, commercial and Medicaid payers do not reimburse on a cost basis, and uncompensated care plus bad debt compress already-thin margins. Technology investments that produce measurable CAH ROI fall into five categories: RCM modernization, clinical documentation AI, remote patient monitoring, telehealth specialty access, and integrated EHR workflows. RHTP funding changes the capital calculus for the first time since 1997, with state procurement flowing Q3 2026 through Q1 2027, though the program’s $50 billion allocation is positioned as partial offset to the $137 billion federal Medicaid reduction in rural areas, not net new capacity funding.
Watch: Critical Access Hospital Reimbursement Explained
A Critical Access Hospital earns 101% of allowable costs on Medicare services, yet the financial position of many CAHs remains fragile. MedPAC’s October 2024 Payment Basics reported that cost-based reimbursement delivers the average CAH approximately $4 million more annually on Medicare FFS than it would receive under Prospective Payment System rates, yet average all-payer profit sits at only $1 to $2 million per year. CHQPR’s January 2026 analysis placed 760 rural hospitals at risk of closing, with 314 at immediate risk within three years. AHA’s April 2025 financial report documented that Medicare reimbursed just 83 cents for every dollar hospitals spent caring for patients in 2023, and from 2022 to 2024 general inflation rose 14.1% while Medicare inpatient payment rates increased only 5.1% . Cost-based reimbursement protects CAHs from some of that pressure on the Medicare side. It does nothing to protect them from the pressures on every other payer line.
That is the financial reality every CAH administrator manages around. Cost-based reimbursement was designed in the 1997 Balanced Budget Act to stop rural hospital closures by ensuring Medicare paid for actual cost rather than a fixed DRG amount that would not cover a low-volume rural facility’s fixed expense base. The design worked for its narrow purpose. The same design also produced a financial model that covers today’s operations but not tomorrow’s modernization.
Technology investment at a CAH is therefore a capital and ROI question, not an operating budget question. The capital source has to come from somewhere cost-based reimbursement does not reach: grants, federal programs, facility renovation budgets, or capital reserves that most CAHs do not have. The ROI has to manifest in margin categories cost-based reimbursement does not bound: Medicaid revenue, commercial revenue, uncompensated care reduction, new service line revenue, denied claims recovery, workforce retention that reduces agency nursing costs.
This guide covers how CAH reimbursement actually works, where the 40% -loss paradox comes from, which technology investments produce measurable ROI at a CAH, how RHTP funding restructures the financial model, and what sustainability looks like after the 2030 RHTP funding cliff.
For the CAH designation context, see What Is a Critical Access Hospital. For the technology architecture specifics, see Technology Stack for a 25-Bed Rural Hospital.
How Are Critical Access Hospitals Reimbursed by Medicare?
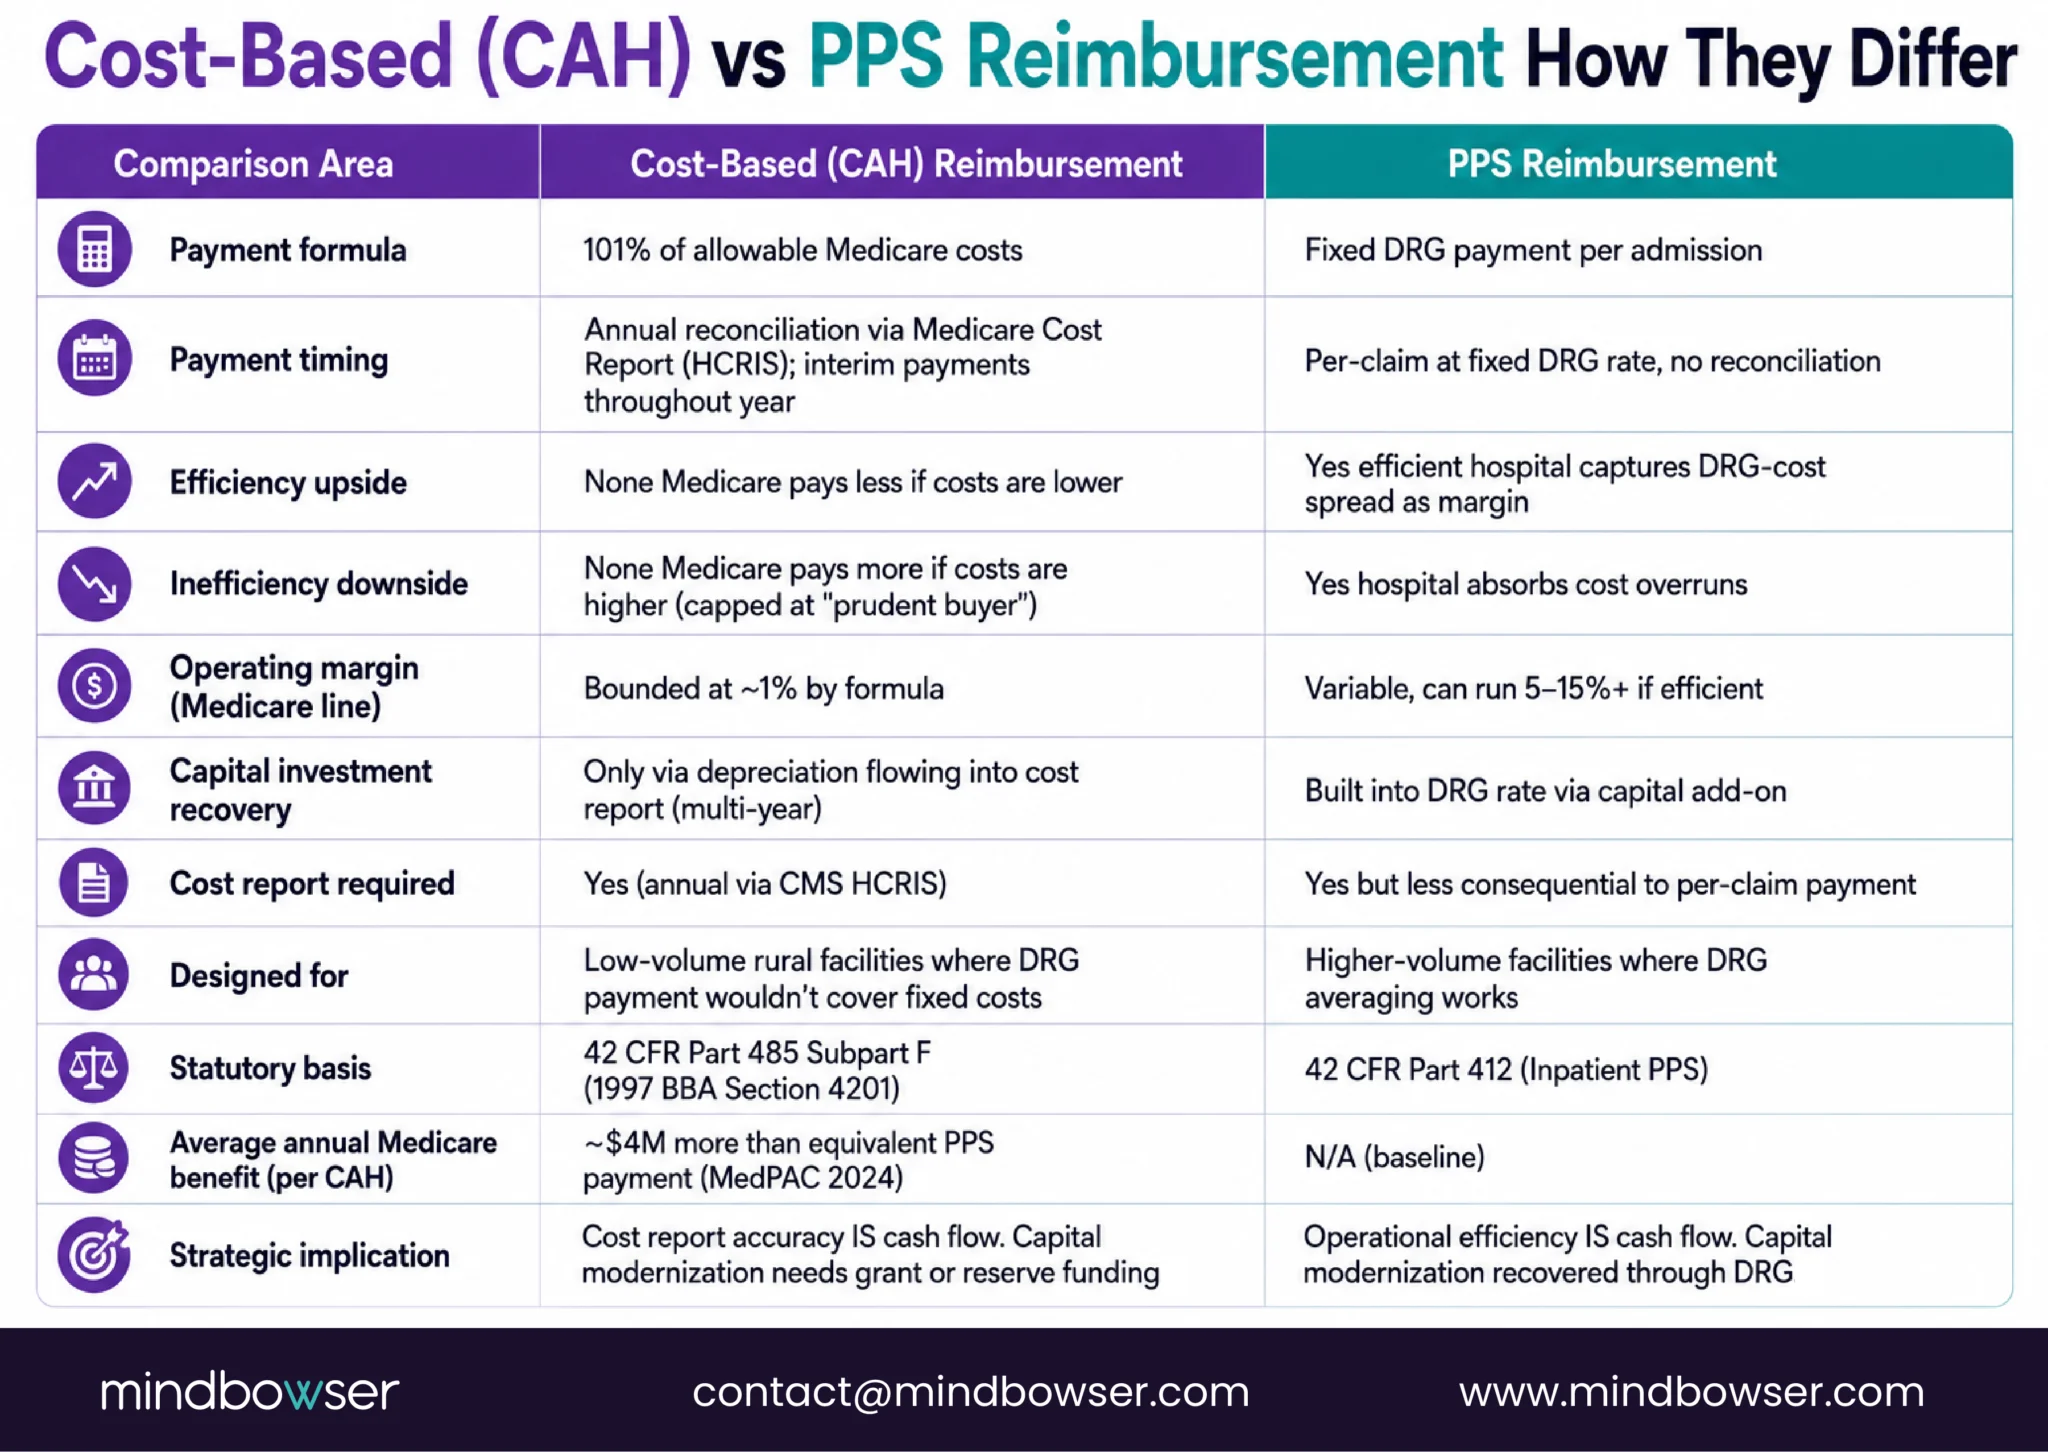
Critical Access Hospitals are reimbursed by Medicare at 101% of allowable costs for services provided to Medicare beneficiaries. This is cost-based reimbursement, codified at 42 CFR Part 485 Subpart F and administered through the Medicare Cost Report process. The 101% rate applies to both inpatient services and outpatient services delivered by the CAH.
This mechanic differs fundamentally from Prospective Payment System (PPS) reimbursement used at most hospitals. PPS hospitals receive fixed payments per Diagnosis-Related Group (DRG) regardless of actual cost. A PPS hospital that operates more efficiently than the DRG payment captures the difference as margin. A PPS hospital that operates less efficiently than the DRG payment absorbs the loss.
Cost-based reimbursement inverts this logic. The CAH submits an annual Medicare Cost Report that documents allowable costs allocated to Medicare services. Medicare pays the documented costs plus 1% . Efficiency does not produce margin expansion (Medicare pays less if costs are lower). Inefficiency does not produce margin contraction (Medicare pays more if costs are higher). The 1% over cost is a small operating margin designed to cover minor variation.
What “allowable costs” includes:
- Direct labor costs allocated to Medicare services
- Supplies and materials allocated to Medicare services
- Depreciation on existing capital equipment
- Allocated administrative overhead
- Allocated facility costs (utilities, maintenance)
- Bad debt on Medicare accounts (specific rules apply)
What “allowable costs” excludes:
- New capital investment at the rate of deployment (only depreciation flows through)
- Costs allocated to non-Medicare services
- Costs that exceed prudent buyer standards
- Specific disallowed costs (entertainment, political contributions, certain vendor relationships)
The Medicare Cost Report is filed annually through the CMS Healthcare Cost Report Information System (HCRIS). Cost report accuracy directly determines reimbursement; errors reduce cash flow materially.
MedPAC’s 2024 Payment Basics publication on Critical Access Hospitals provides the authoritative reference for the full mechanic.
What Does Cost-Based Reimbursement Actually Cover (and What It Doesn’t)
The specific line items matter because they determine which financial problems cost-based reimbursement solves and which it does not.
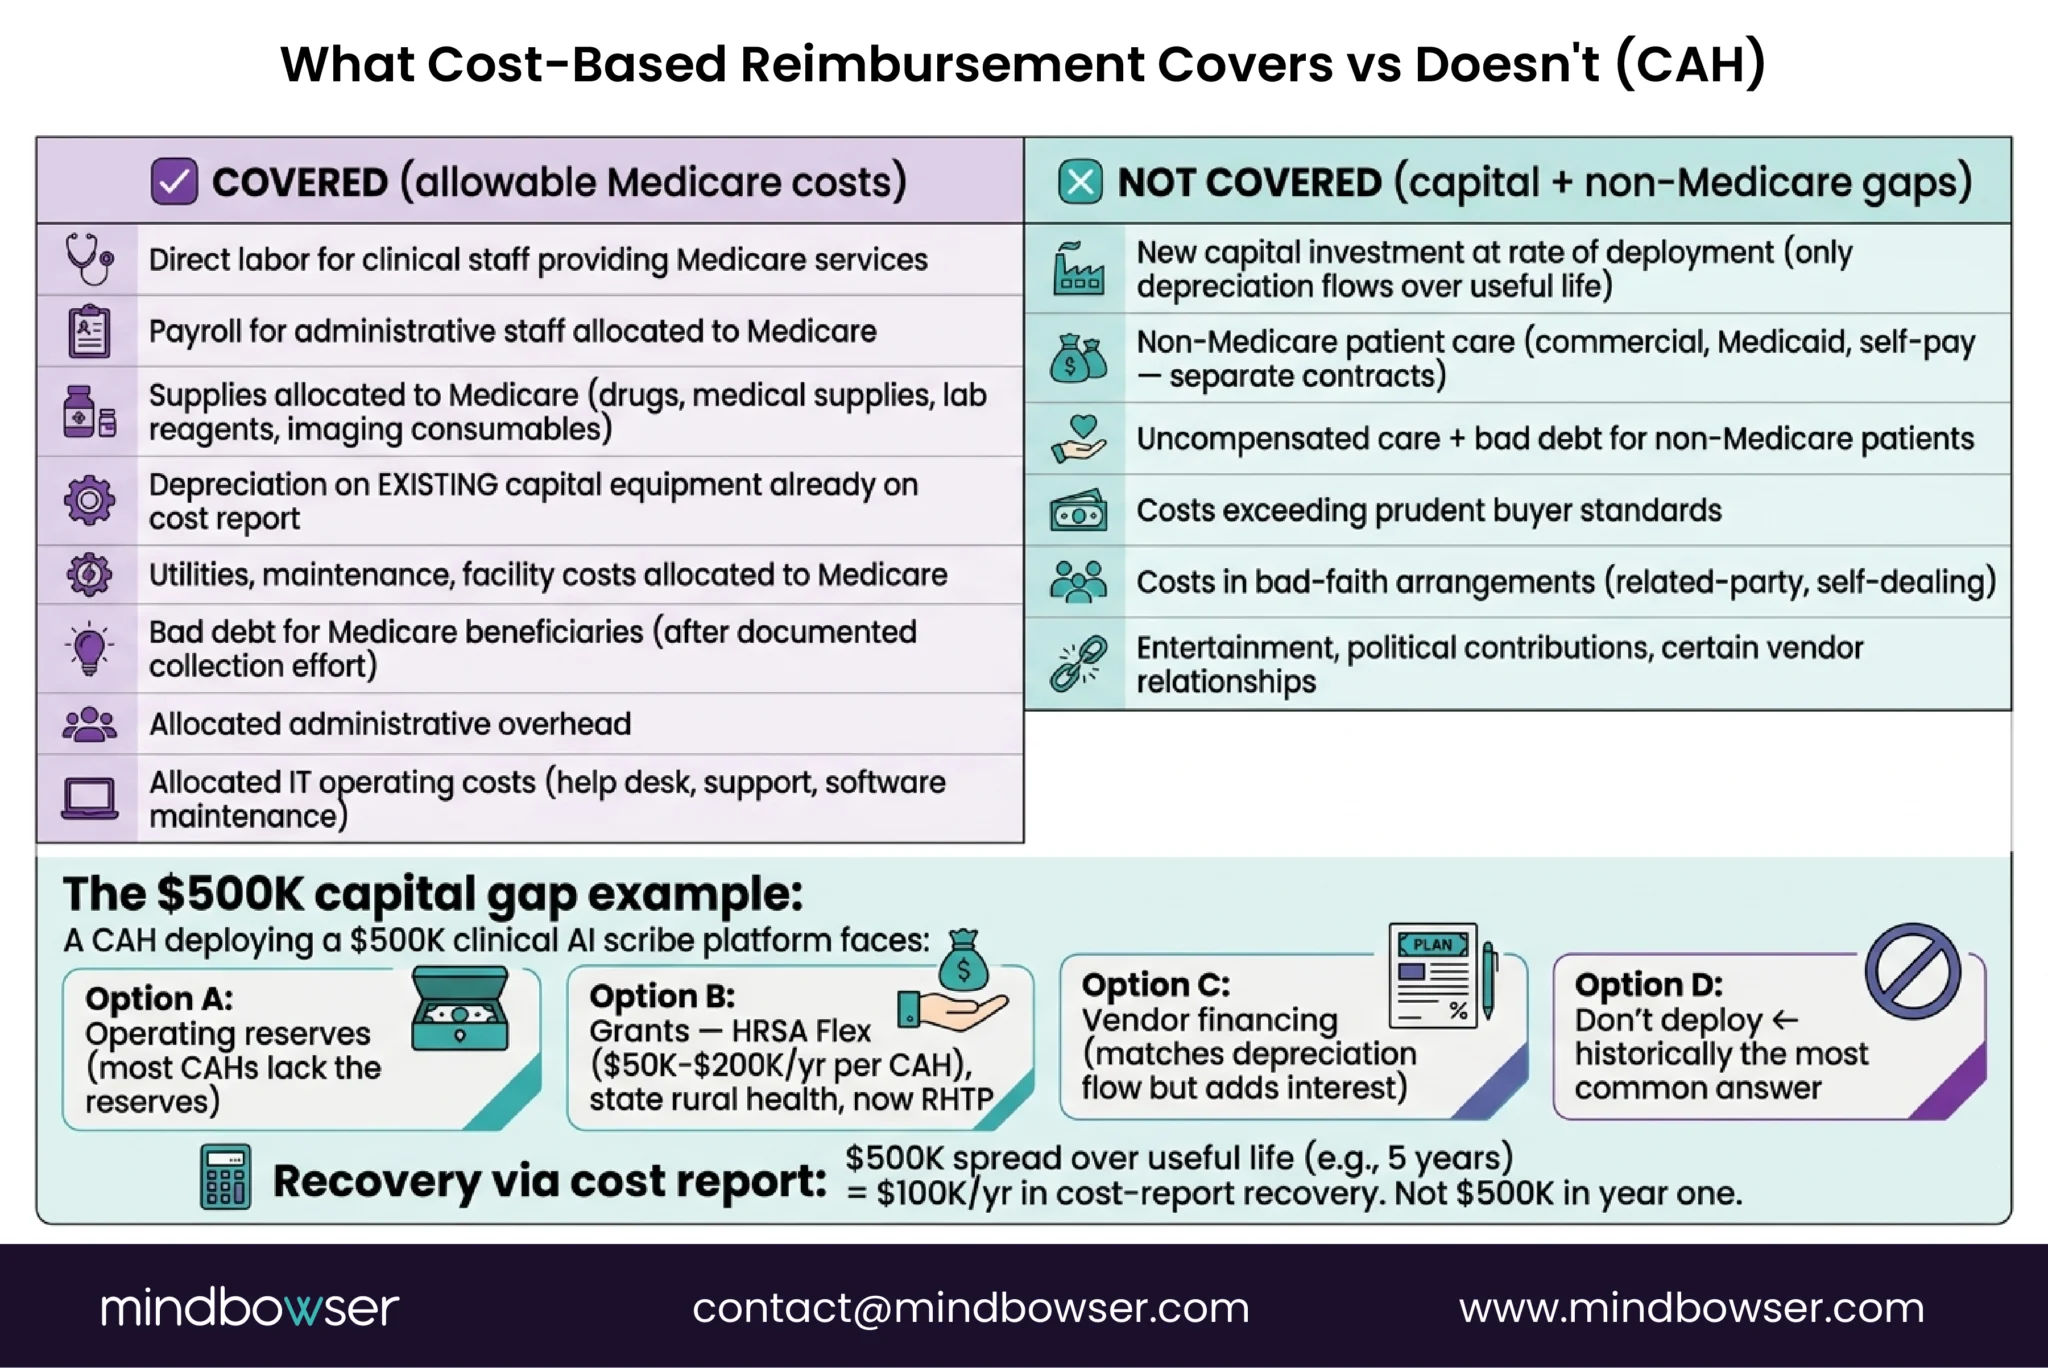
Cost-based reimbursement covers:
- Payroll for clinical staff providing Medicare services
- Payroll for administrative staff allocated to Medicare
- Supplies used in Medicare patient care (drugs, medical supplies, lab reagents, imaging consumables)
- Utilities, maintenance, and facility costs allocated to Medicare activity
- Depreciation on existing capital equipment already on the cost report
- Bad debt for Medicare beneficiaries (subject to specific collection effort requirements)
- Allocated IT operating costs (help desk, support contracts, software maintenance)
Cost-based reimbursement does not cover:
- New capital investment at the rate of deployment. Only depreciation flows through, which means a $500,000 EHR migration produces $500,000 / useful life in annual cost report recovery, not $500,000 in year one.
- Non-Medicare patient care. Commercial and Medicaid patients are reimbursed under contracts with those payers, which do not follow cost-based mechanics.
- Uncompensated care and charity care. Uninsured patients generate costs the CAH incurs but does not recover through Medicare.
- Costs that exceed prudent buyer standards. If CMS determines a cost is higher than reasonable for the service provided, the excess is disallowed.
- Costs incurred in bad-faith arrangements. Related-party transactions, self-dealing, and similar structures are disallowed.
The capital gap in plain terms:
A CAH that needs to deploy a $500,000 clinical AI scribe platform to address physician burnout faces a choice. Option A: fund the deployment from operating reserves (most CAHs lack the reserves). Option B: fund from grants (HRSA Flex, state rural health, now RHTP). Option C: vendor financing with payments amortized over the useful life (matches depreciation flow but adds interest expense). Option D: do not deploy.
Historically, Option D has been the most common answer. RHTP funding changes this in 2026.
Why 40% of CAHs Operate at a Loss Despite Cost-Based Reimbursement
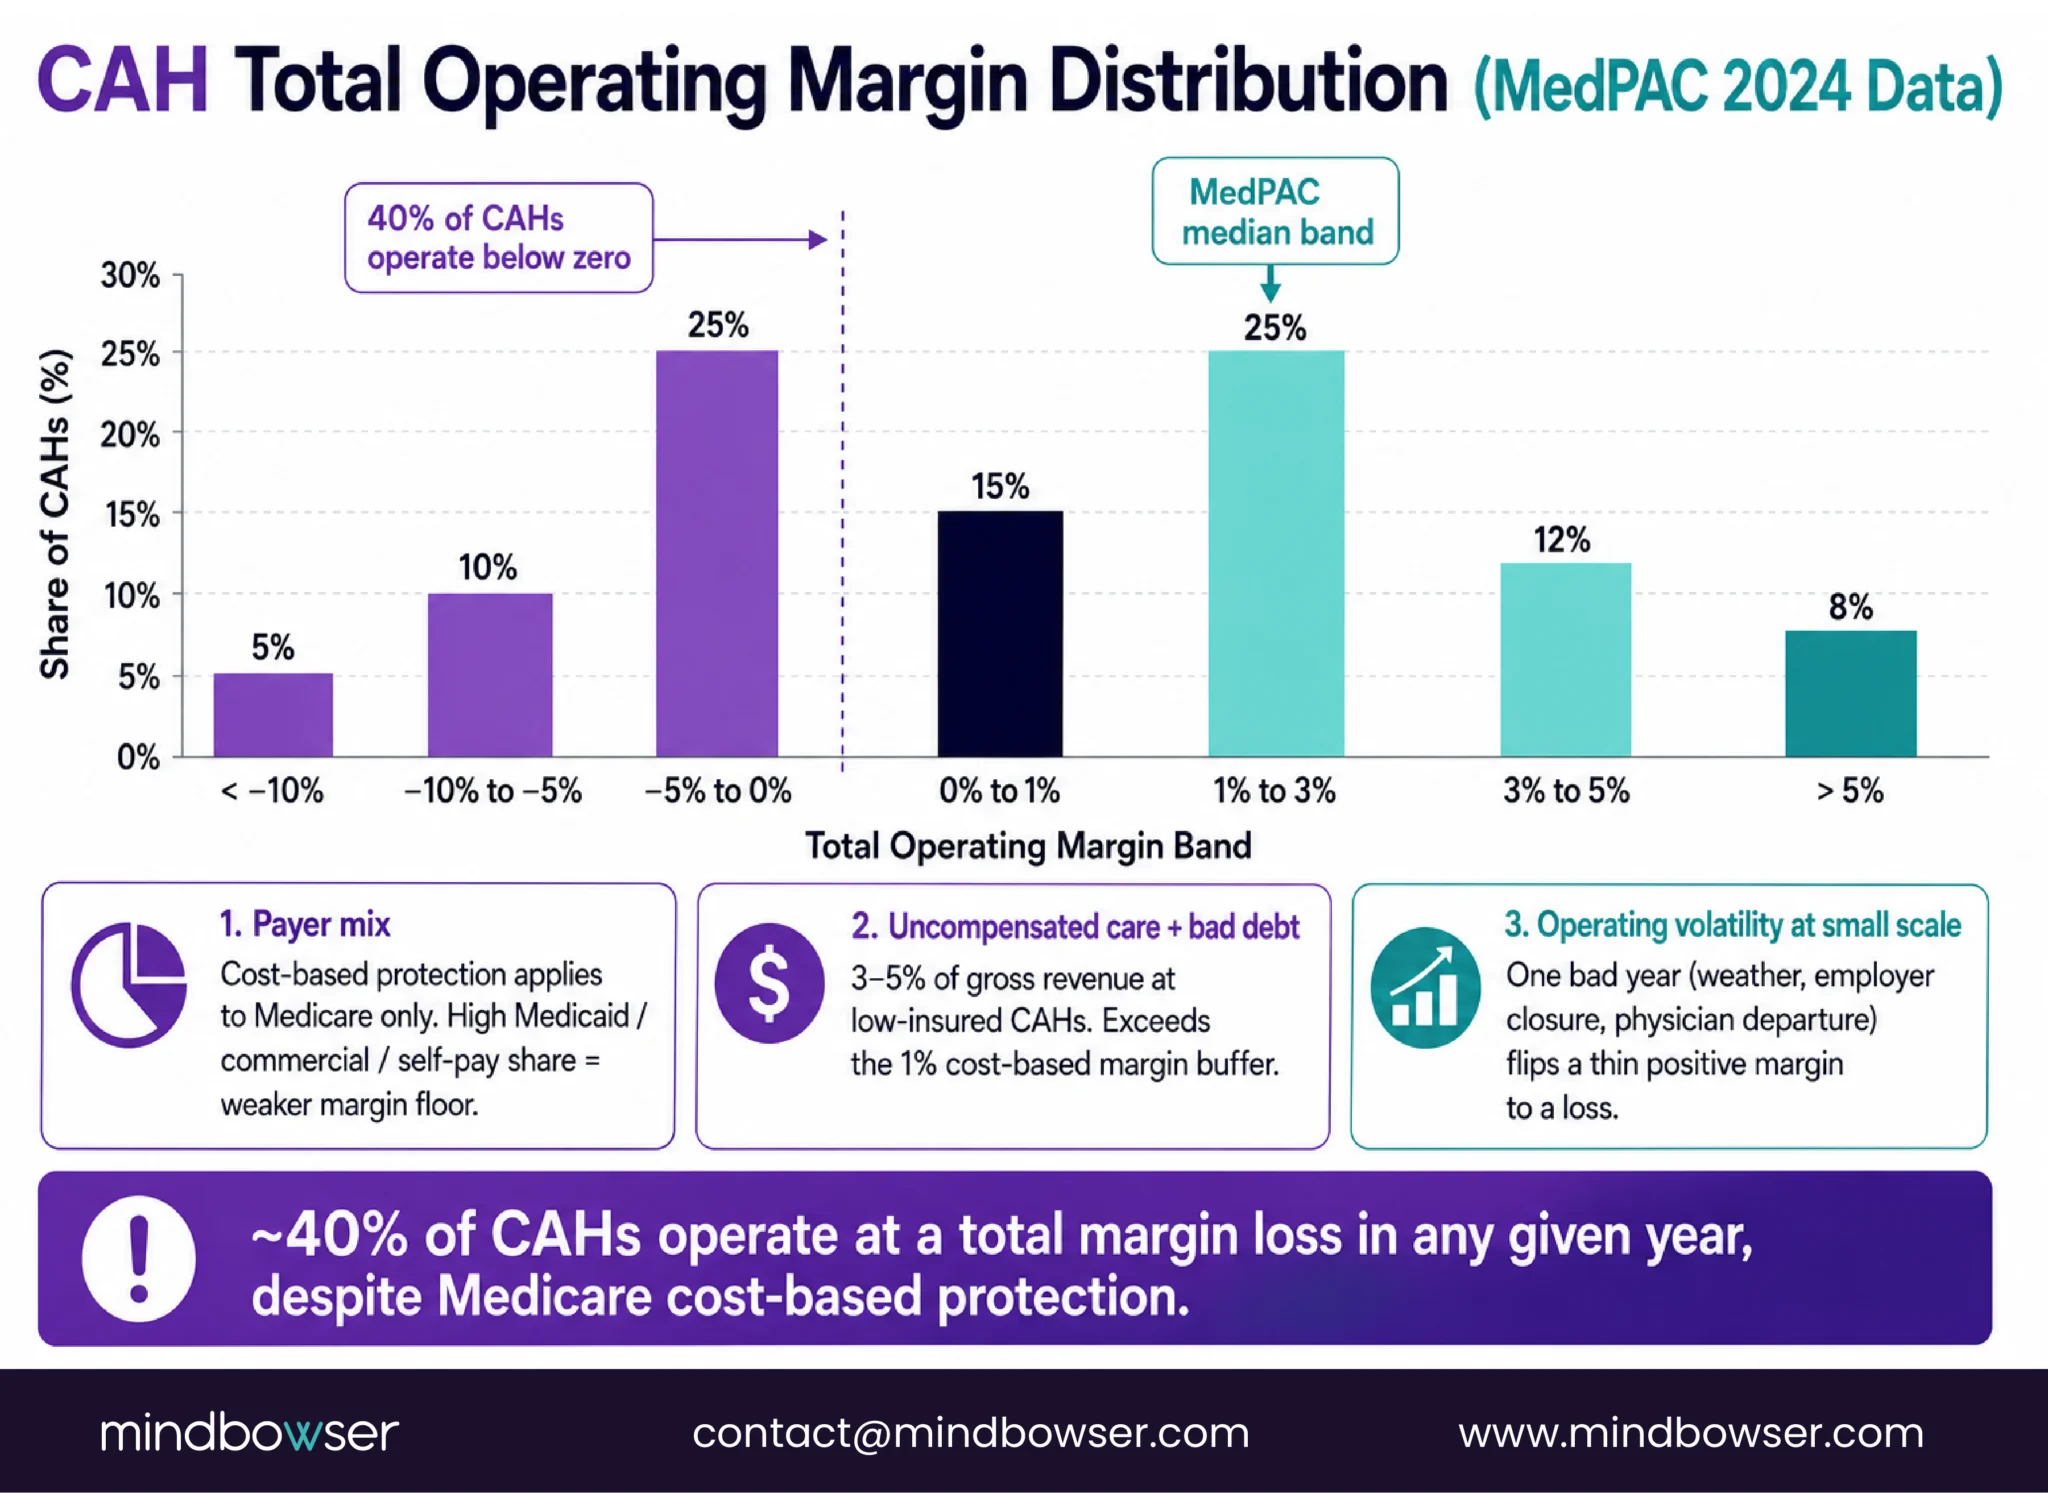
MedPAC’s 2024 data shows roughly 40% of CAHs operating at a negative total margin in any given year. Cost-based reimbursement is protective but not sufficient. Three mechanics explain the loss distribution.
Mechanic 1: Commercial and Medicaid payer mix.
Cost-based reimbursement at 101% applies only to Medicare services. Other payers reimburse under different contracts. A CAH with 40% Medicare, 40% Medicaid, and 20% commercial payer mix receives cost-based protection on only 40% of its revenue. The other 60% is subject to negotiated rates that may or may not cover cost.
A CAH with 60-70% Medicare mix has stronger cost-based protection. A CAH with 30% Medicare mix has weaker protection. Payer mix is largely determined by service area demographics, not by hospital operational choices.
Mechanic 2: Uncompensated care and bad debt erosion.
Uninsured patients generate costs without corresponding revenue. Bad debt (insured patients who do not pay their share) follows the same pattern. Cost-based reimbursement allows bad debt recovery on Medicare accounts after documented collection effort, but commercial and Medicaid bad debt is absorbed. For a CAH in a low-insured service area, uncompensated care alone can run 3-5 % of gross revenue, which exceeds the 1% operating margin.
Mechanic 3: Operating volatility at small scale.
A 25-bed hospital’s financial model is more sensitive to operating volatility than a larger facility. A single unusual year (weather event, local employer closure, physician departure) affects the cost report significantly. Smooth multi-year margins are harder to achieve at small scale.
Combined effect:
A CAH with unfavorable payer mix plus material uncompensated care plus one volatile operating year moves from breakeven to loss in a single fiscal cycle. The cost-based protection is real but does not immunize against these three mechanics operating together.
The GAO’s 2023 report (GAO-23-105950) on CAH financial viability reinforces this pattern: Medicare cost-based reimbursement is necessary but not sufficient for rural hospital financial sustainability.
How Medicaid and Commercial Payers Change the Math
Payer mix is the single largest variable in CAH financial performance. The components matter because each payer class operates under different rules.
Medicare (cost-based for CAHs):
101% of allowable costs. Protective. Operating margin bounded at 1% . Cost report accuracy directly determines cash flow.
Medicaid (state-specific, usually not cost-based):
State Medicaid programs reimburse CAHs under state-specific payment systems. Some states include CAH-specific supplemental payments that approximate cost-based treatment. Most states reimburse at rates below cost, which is the “Medicaid gap” that shows up as revenue shortfall on cost reports. RHTP funding includes payment model development (Element B) that may enable better Medicaid coverage in some states post-2026.
Commercial payers (negotiated rates):
Commercial insurer contracts reimburse at rates negotiated between the payer and the hospital. CAH bargaining power with commercial payers is typically weak due to low patient volume and limited network pull. Commercial rates at CAHs often follow Medicare rate schedules with modest markups, which in cost-based terms means minimal margin above cost.
Self-pay and uninsured (variable):
Cash collection from uninsured patients is historically 10-25% of billed charges. Collection effort is itself a cost. Patient financial services modernization can move this to 20-40% range, which is meaningful margin improvement at CAH scale.
Medicare Advantage (complicated):
Medicare Advantage plans pay CAHs at rates negotiated with the plan, not at cost-based rates. This is a recurring irritant for CAH CFOs because it means Medicare Advantage patients cost the CAH money relative to traditional Medicare patients, while CMS has not fully addressed the rate differential. Medicare Advantage market share is growing, which puts pressure on CAH cost-based protection.
Payer mix impact on margin sensitivity:
| Payer class | Typical CAH share | Cost recovery | Margin contribution |
|---|---|---|---|
| Medicare (traditional) | 40-55% | 101% | Small positive |
| Medicare Advantage | 10-20% | ~95-100% | Small negative |
| Medicaid | 15-30% | 70-95% of cost | Negative |
| Commercial | 10-25% | Varies | Variable |
| Self-pay | 3-8% | 10-40% collected | Material negative |
The net operating margin at a CAH is a weighted average of these positions, plus uncompensated care absorption, plus the 1% cost-based margin on Medicare services. A 1-3% operating margin on a $25M annual revenue CAH represents $250K-$750K of absolute margin. Small fluctuations in any payer class move the facility between surplus and loss.
Still Unsure Which Technology Investments Actually Pay Off for Critical Access Hospitals?
What Technology Investments Produce Measurable ROI at a CAH
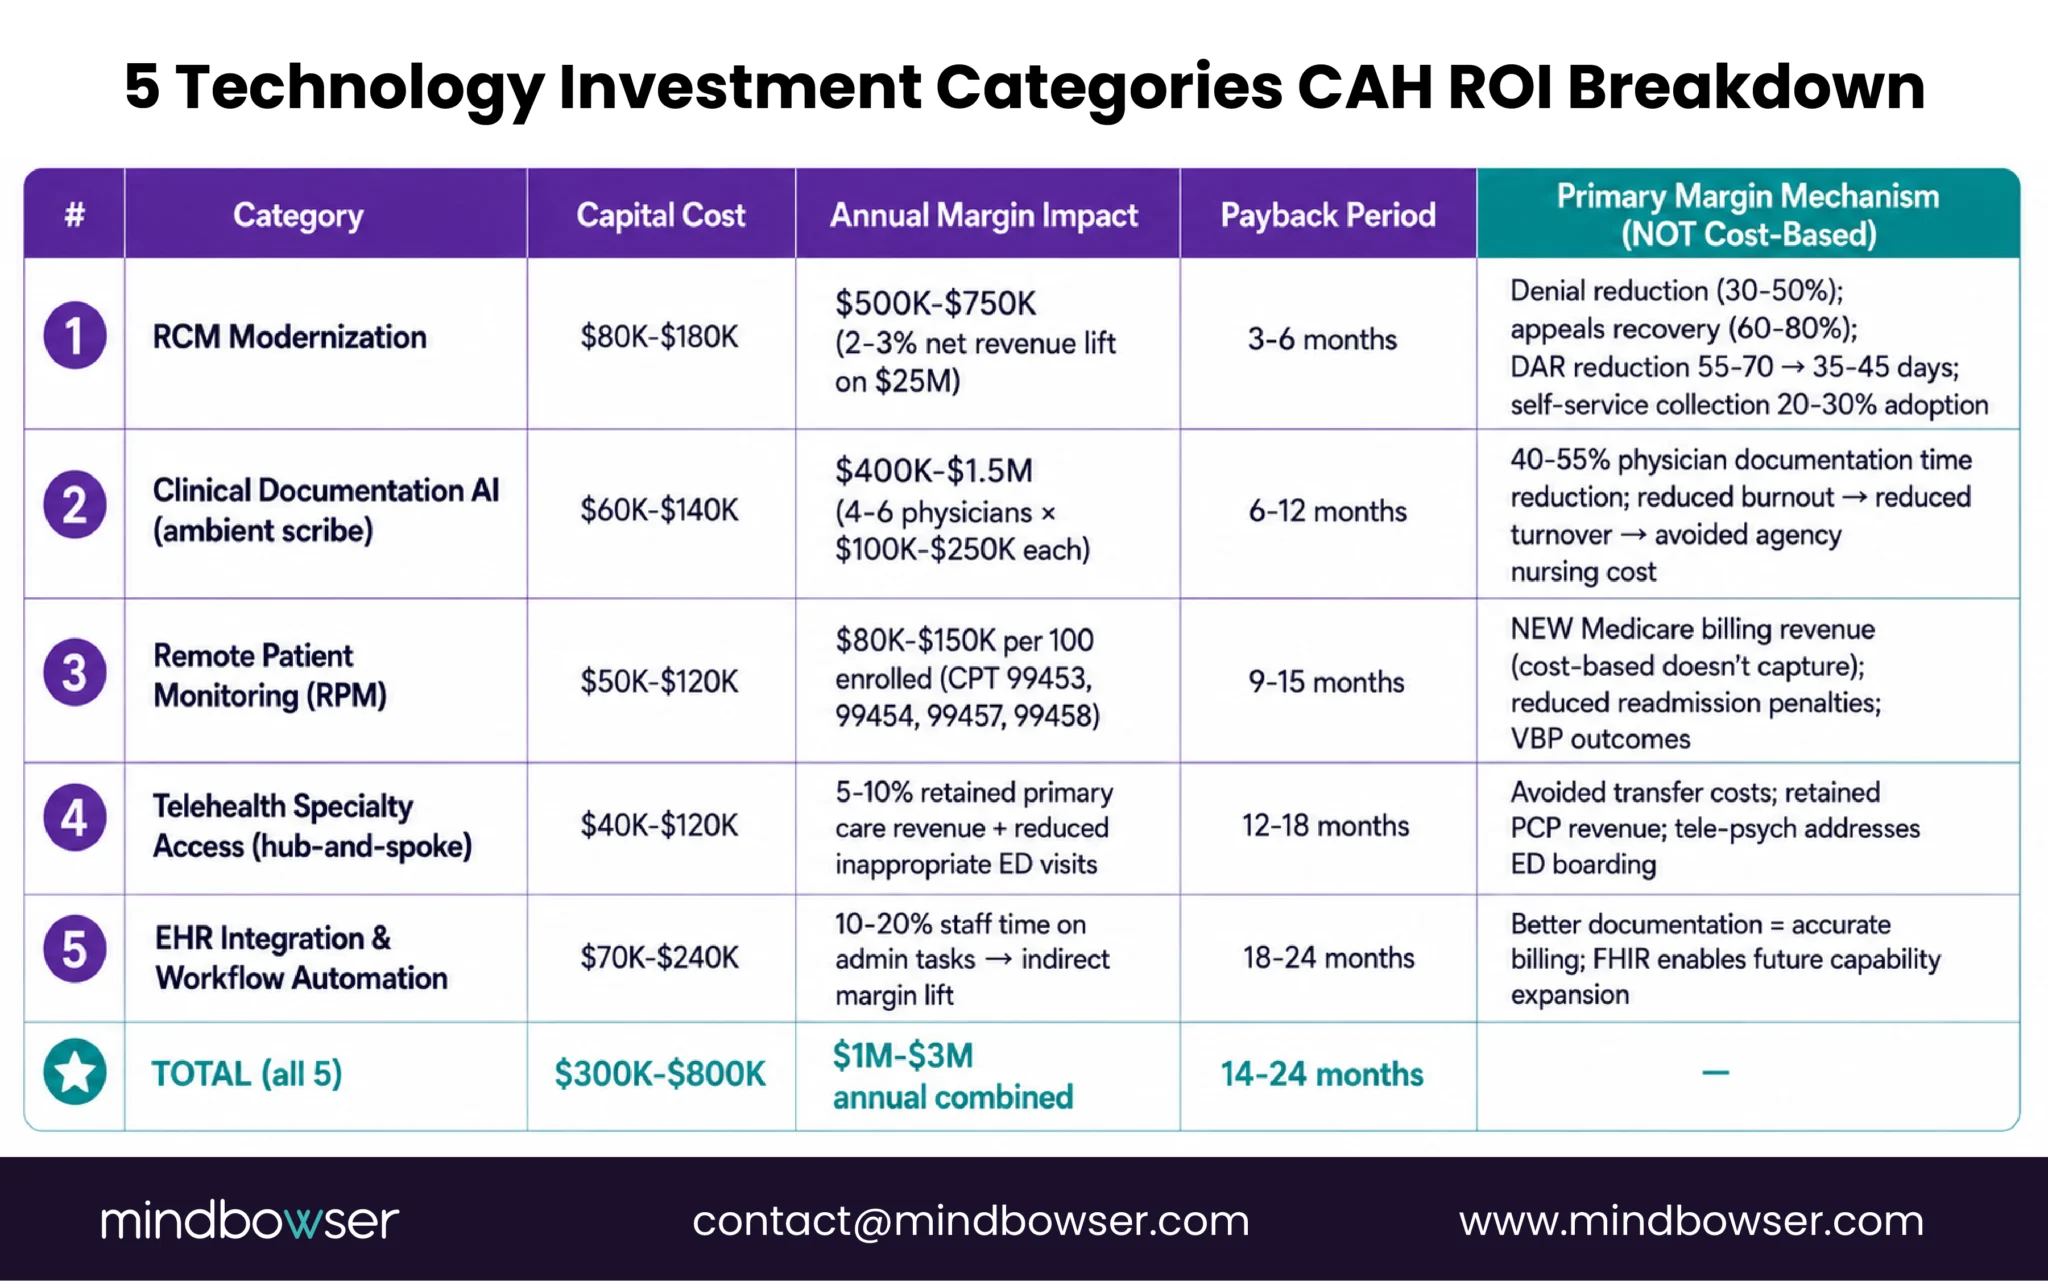
Technology ROI at a CAH manifests in margin categories that cost-based reimbursement does not cover: commercial revenue capture, denied claims recovery, uncompensated care reduction, new billable service line revenue, workforce retention. The investments that produce measurable ROI fall into five categories.
Category 1: Revenue Cycle Management (RCM) modernization
Modern RCM platforms improve denial rates, claims submission speed, patient self-service collection, and eligibility verification. Typical CAH impact:
- 30-50% reduction in denial rates (from unoptimized baseline)
- 60-80% recovery on denied claims through structured appeals workflow
- 20-30% self-service patient collection adoption (reduces collection overhead)
- Days in accounts receivable (DAR) reduced from 55-70 days to 35-45 days
Net financial impact: 2-3% net revenue improvement for a CAH moving from legacy RCM to modern integrated RCM. On $25M annual revenue, this is $500K-$750K in annual margin capture.
Category 2: Clinical documentation AI (ambient scribe)
Ambient AI scribes reduce physician documentation time by 40-55% per encounter, per KLAS pilots and our AI Medical Summary deployments. The ROI mechanism at a CAH:
- 1.5-2.5 hours per physician per shift recovered from documentation
- Reduced after-hours charting and physician burnout, which directly reduces turnover
- Faster note completion improves claims submission speed
- Avoided agency nursing costs when reduced physician burnout retains regular staff
Net financial impact at a CAH: $100K-$250K annual margin contribution per physician when retention effects are quantified. For a CAH with 4-6 physicians, this is $400K-$1.5M annual impact.
Category 3: Remote Patient Monitoring (RPM)
Medicare RPM billing codes (99453, 99454, 99457, 99458) generate revenue that cost-based reimbursement does not capture. The ROI mechanism:
- $80K-$150K annual RPM billing revenue per 100 enrolled patients
- Reduced readmission penalties under value-based programs
- Chronic disease management outcome improvements that support VBP metrics
Net financial impact: $80K-$150K incremental annual revenue per 100-patient cohort, growing as enrollment scales.
Category 4: Telehealth specialty access
Hub-and-spoke telehealth preserves primary care revenue at the CAH while providing specialty access. The ROI mechanism:
- Avoided transfer costs (transportation, lost bed days, referral leakage)
- Retained primary care follow-up revenue (specialty consult does not remove the primary care patient)
- Tele-psych specifically addresses behavioral health access gaps that otherwise cause ED boarding
Net financial impact: Harder to quantify directly, but typical CAH implementations report 5-10% improvement in retained primary care revenue plus material reduction in inappropriate ED visits.
Category 5: EHR integration and workflow automation
Integrated EHR workflows reduce staff time on manual data entry, improve clinical documentation accuracy (which improves billing), and enable automation across RCM, clinical, and patient engagement workflows. The ROI mechanism:
- 10-20% reduction in staff time on administrative tasks
- Improved documentation supports accurate billing and compliance
- FHIR-based integration enables future capability expansion
Net financial impact: Indirect but material. Typically surfaces as margin improvement across other categories rather than standalone impact.
Combined technology ROI at a CAH:
A CAH that deploys all five categories captures $1M-$3M in combined annual margin impact over 2-3 years post-implementation. The capital cost to deploy all five runs $300K-$800K. Payback typically occurs in 14-24 months, depending on deployment scope and staff adoption.
The Capital Problem: Why CAHs Can’t Fund Their Own Modernization
The ROI above assumes the CAH can fund the initial deployment. Most CAHs cannot, which is the structural reason CAH technology modernization has been persistently underfunded.
The capital math:
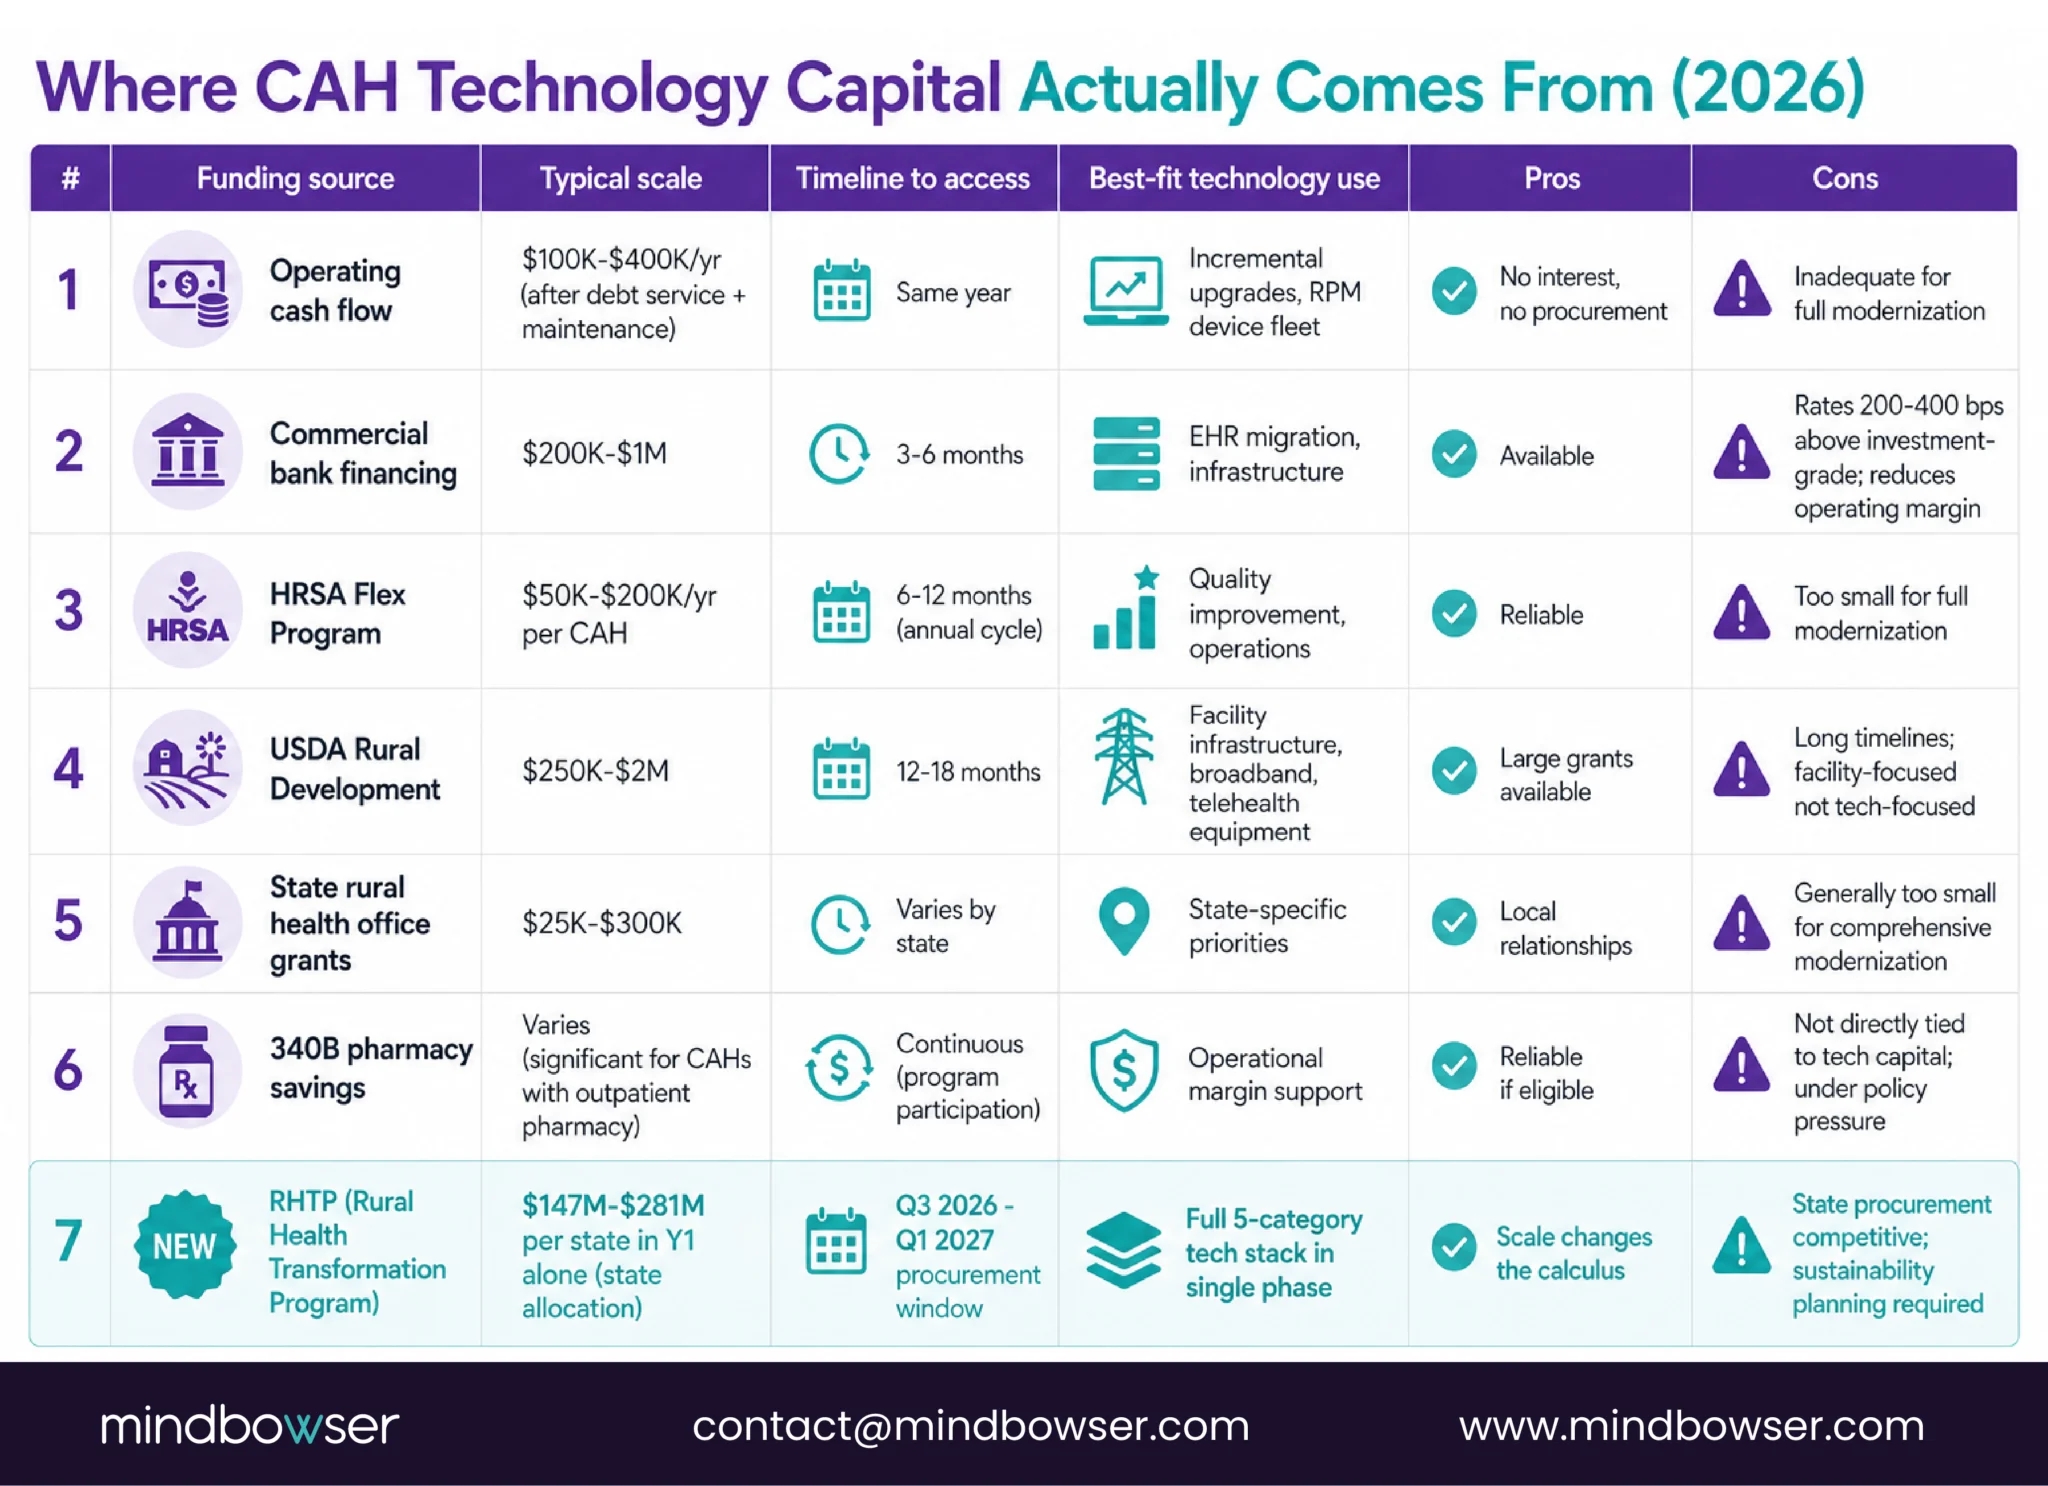
A CAH with $25M annual revenue and 1-3% operating margin generates $250K-$750K in annual operating cash flow. Depreciation adds back $500K-$1M on existing capital assets, producing $750K-$1.75M in total cash flow available for reinvestment. Debt service on existing obligations consumes some share. Facility maintenance (roofs, HVAC, basic equipment replacement) consumes more. What remains for technology capital investment is typically $100K-$400K per year.
A full technology stack modernization ($300K-$800K across the five ROI categories) therefore exceeds a single year of available capital at most CAHs. Phasing helps but delays the ROI realization.
Why banks do not solve this:
Commercial bank financing for CAH technology is available but expensive. CAHs are considered higher credit risk due to operating margin volatility and limited collateral. Interest rates typically run 200-400 basis points above investment-grade rates. Debt service reduces operating margin, which reduces capital available for next-round investment.
Why existing federal programs do not solve this:
- HRSA Flex Program: Grants support quality improvement and operations, typically $50K-$200K per CAH per year. Meaningful but too small to fund full modernization.
- USDA Rural Development: Infrastructure loans and grants, often facility-focused rather than technology-focused. Application timelines are long.
- State rural health office grants: State-specific, varying in size and scope. Generally too small to fund comprehensive modernization.
- 340B pharmacy savings: Captured through drug discount program participation. Meaningful for CAHs with outpatient pharmacy operations, but not directly tied to technology capital.
This is the problem RHTP was designed to address.
How RHTP Funding Restructures the CAH Financial Model
The Rural Health Transformation Program provides capital at a scale that changes the CAH technology modernization calculation for the first time since 1997.
The funding scale:
$10 billion per year across all 50 states, FY2026-FY2030. State allocations range from $147M (New Jersey) to $281M (Texas). States that include CAH-targeted activities in their plans direct meaningful shares of this funding toward CAH technology modernization. Massachusetts, for example, allocates portions of its $291M Initiative I (Population Health Advancement) and $83M Initiative VI (Technology Interoperability) toward CAH-eligible activities.
What this means for a CAH in 2026-2027:
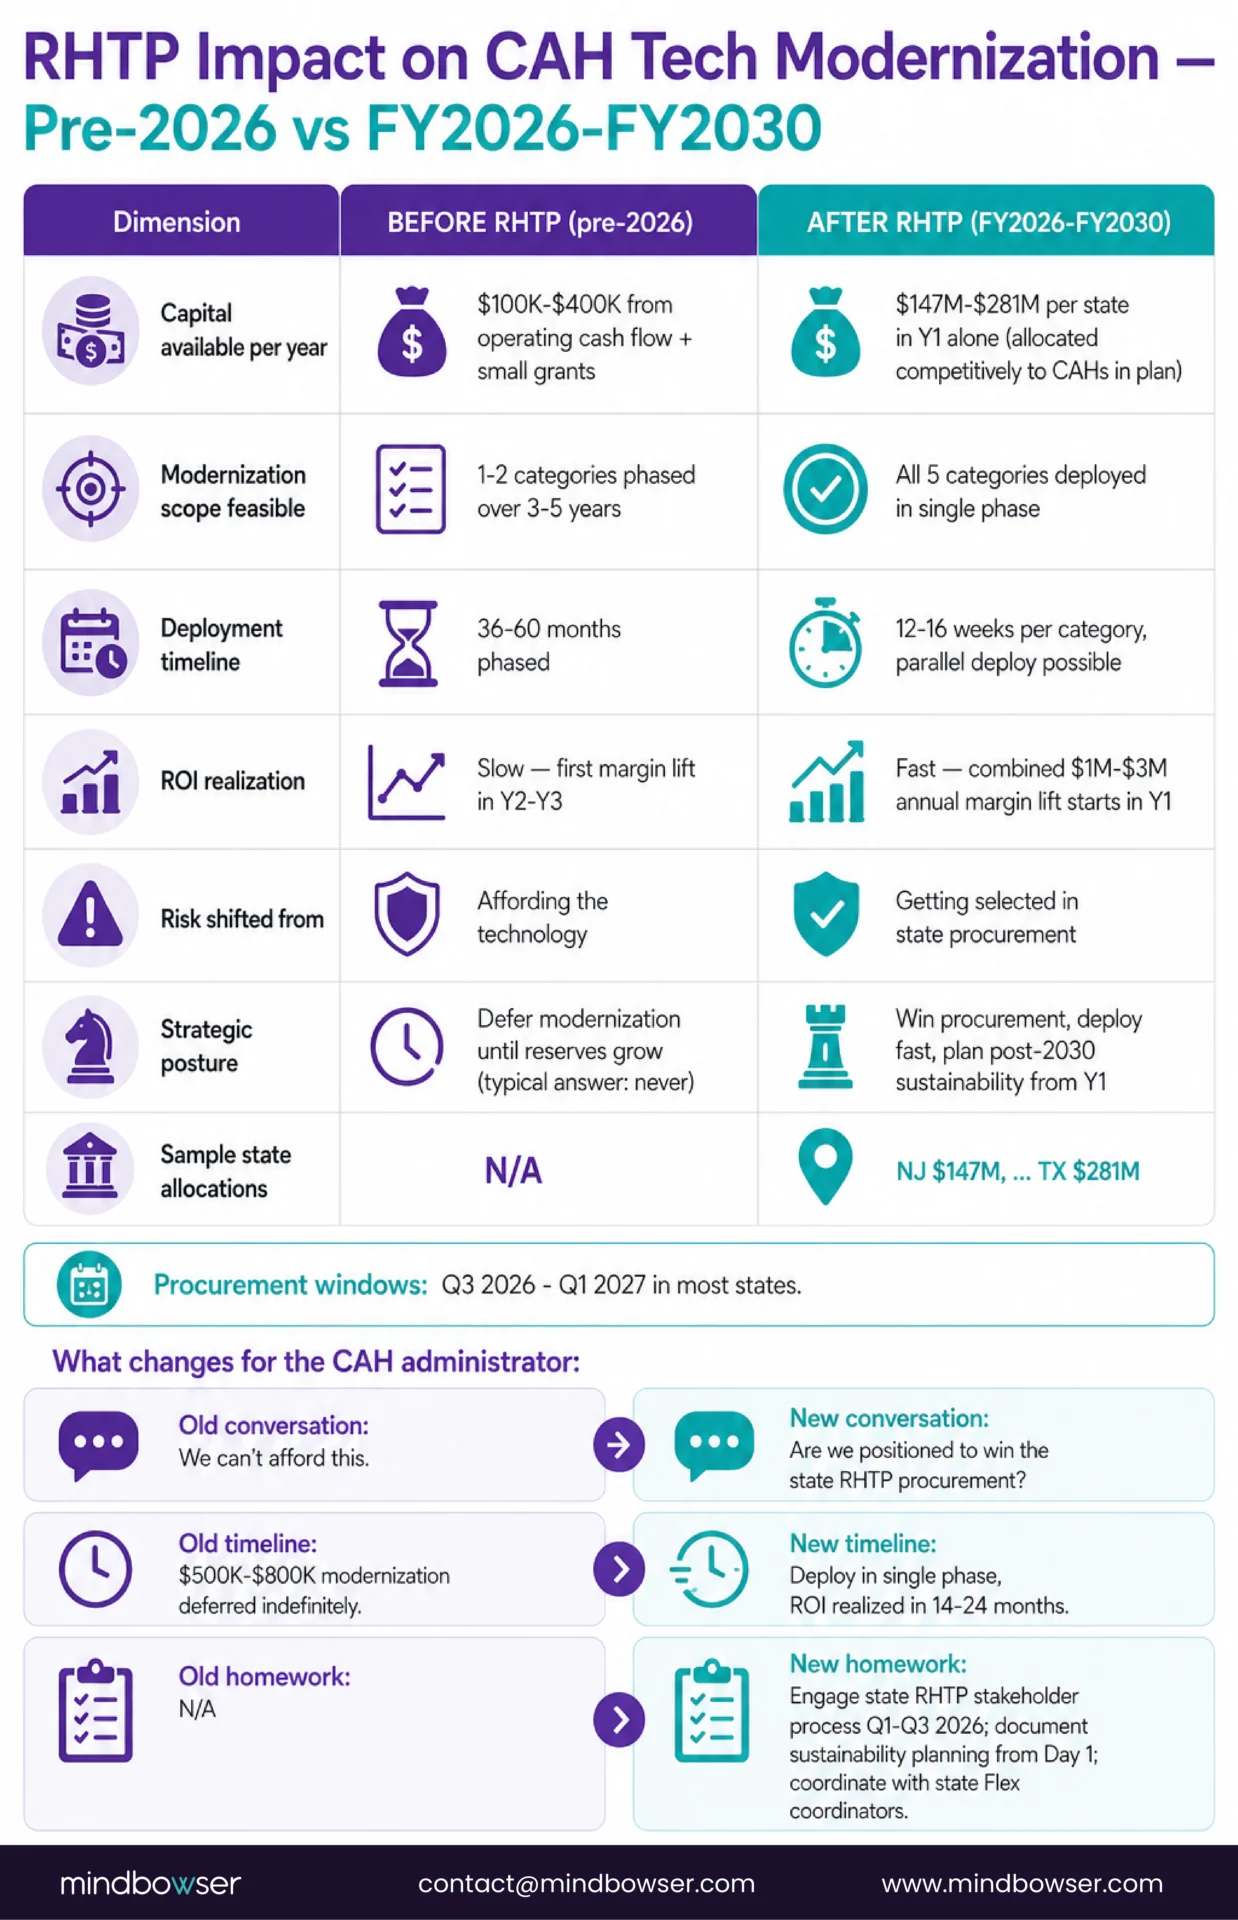
A CAH administrator who previously faced a $500K-$800K technology modernization capital gap now has a realistic path to grant-funded deployment through state RHTP procurement. The procurement window opens Q3 2026 through Q1 2027 in most states. Selected CAHs receive funded technology deployments administered either directly or through prime contractors or through state eHealth organizations.
The financial restructuring:
- Capital investment that would have been impossible is now fundable. The five-category technology stack can be deployed in a single phase rather than over 3-5 years.
- Operating margin impact manifests faster. Faster deployment means faster ROI realization in the cost report cycles.
- Risk shifts from facility capital to procurement alignment. The new challenge is not affording the technology. It is getting selected in state procurement.
What CAHs need to do to qualify:
- Engage state RHTP stakeholder processes during Q1-Q3 2026 to ensure facility needs are reflected in RFPs
- Structure technology investment requests around specific statutory elements (C, D, F, H for most technology)
- Document sustainability planning for post-2030 operations from the beginning, not as an afterthought
- Coordinate with state Flex Program coordinators who often participate in RHTP governance
For the full RHTP funding mechanics, see our RHTP Funding Technology Guide and Rural Health Transformation Program pillar.
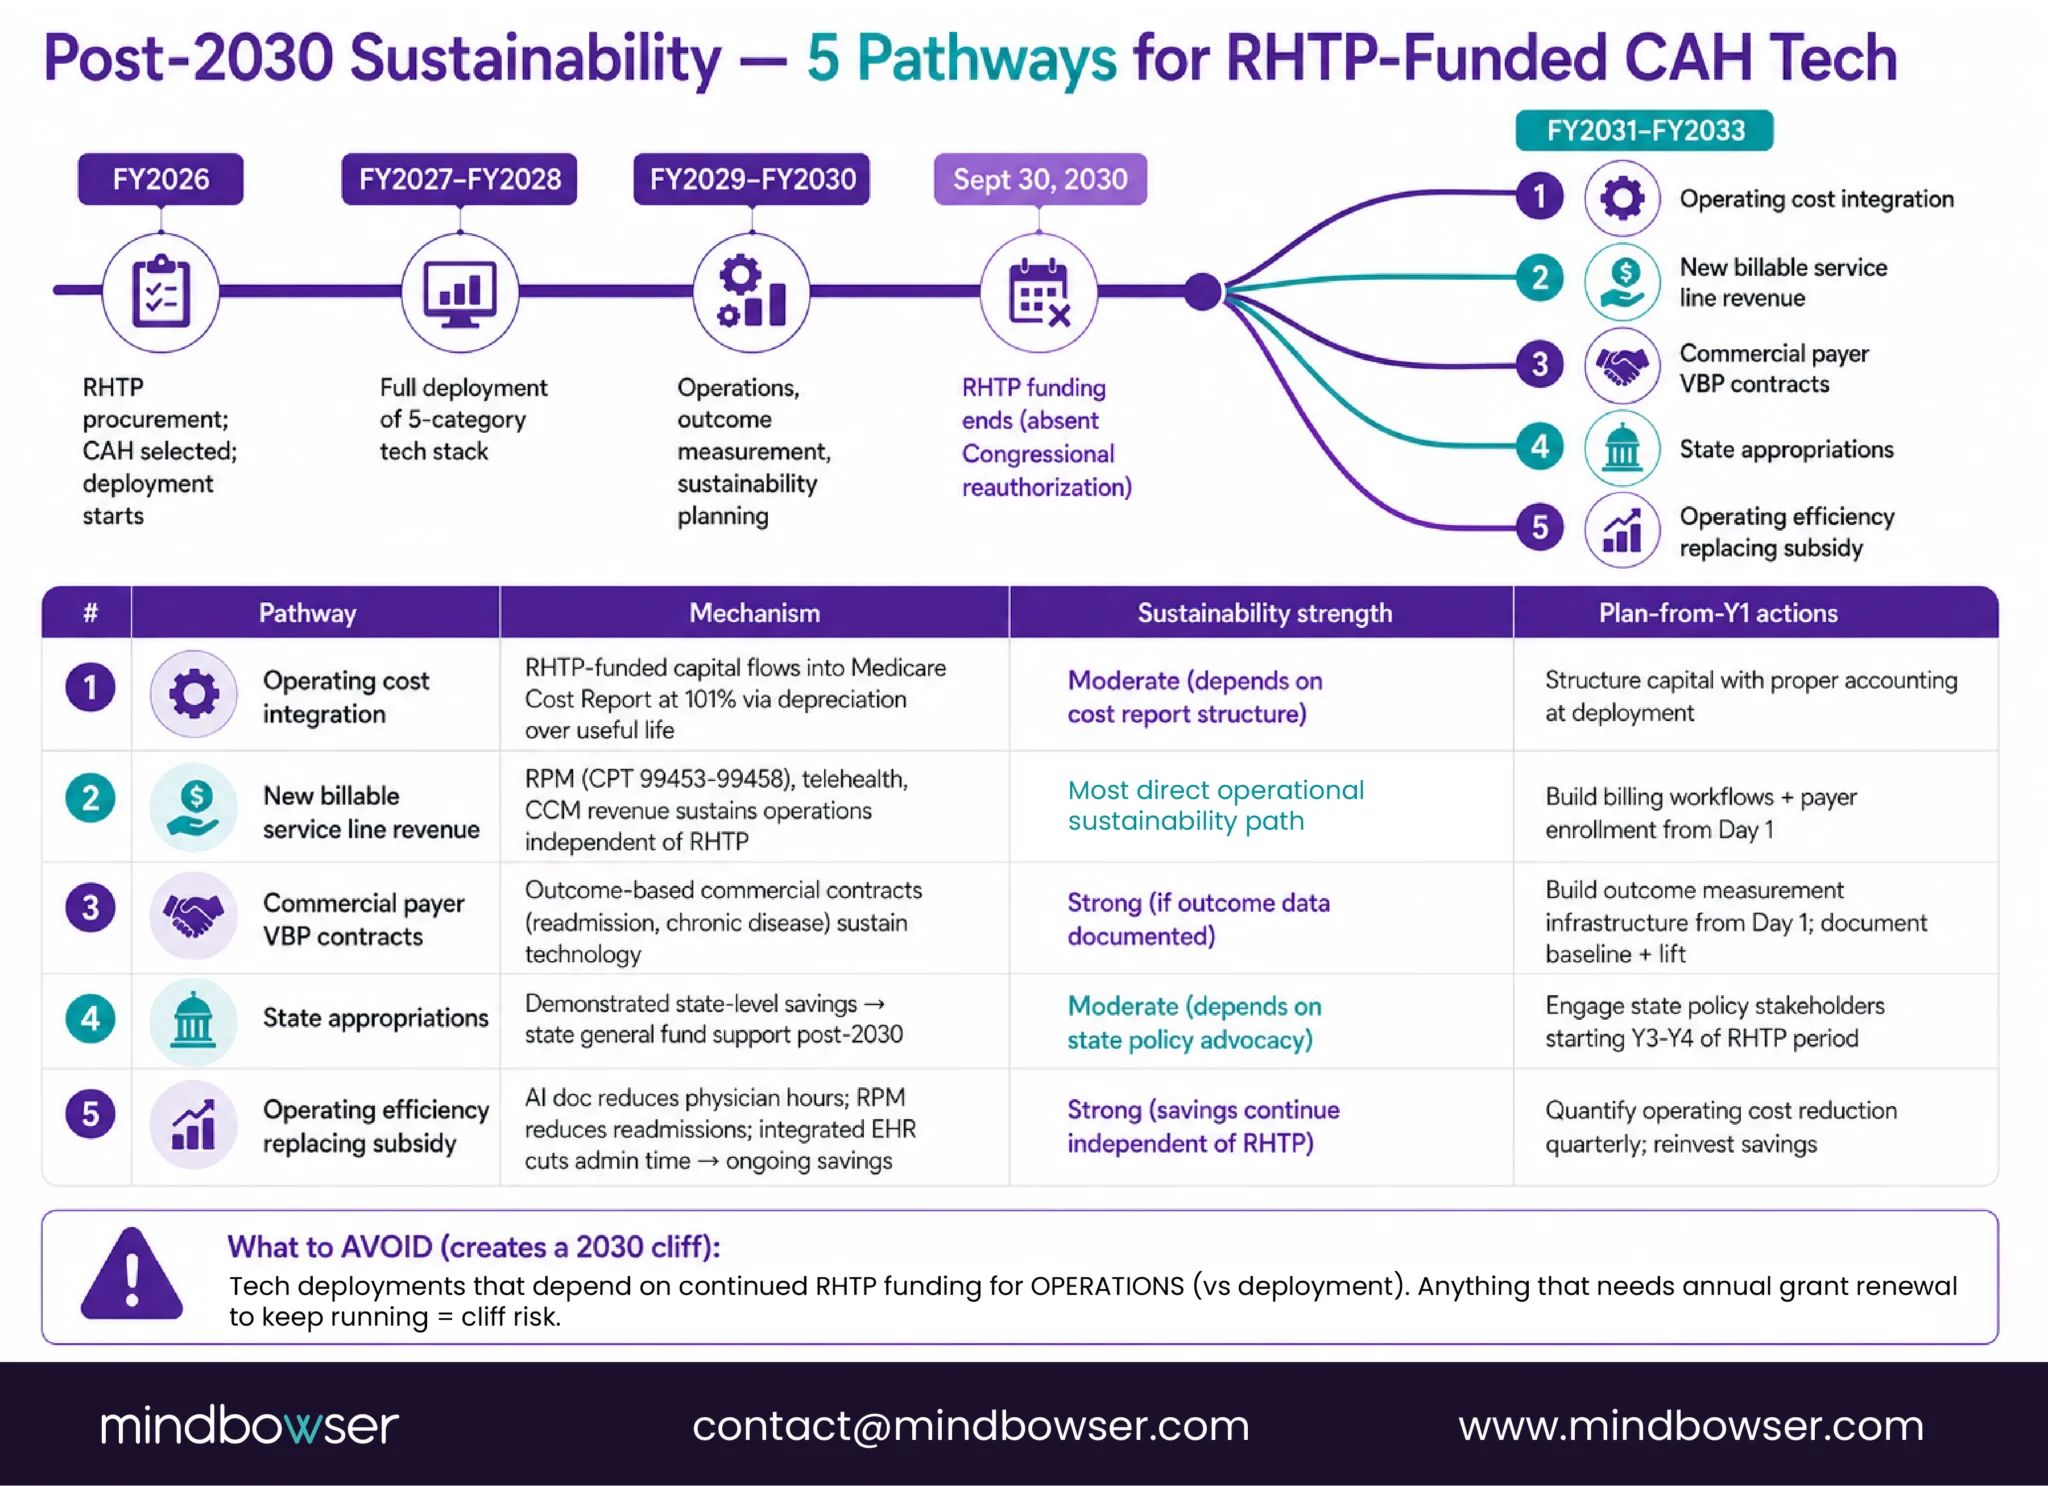
Post-2030 Sustainability: When RHTP Funding Ends
RHTP funding ends September 30, 2030 absent Congressional reauthorization. The five-year implementation horizon produces a financial bridge question CAHs must answer during the funding period, not after it ends.
Five sustainability pathways available to CAHs:
- Pathway 1: Operating cost integration. Technology deployed under RHTP that becomes part of operating cost by 2030 flows into the Medicare Cost Report at 101% reimbursement. Depreciation on RHTP-funded capital recovers through the cost report over the asset’s useful life. This is the most straightforward sustainability path but requires initial capital investment structure that supports depreciation accounting.
- Pathway 2: New billable service line revenue. Technology that enables new billable services (RPM under Medicare CPT 99453-99458, telehealth, CCM) generates revenue that sustains operations post-2030 regardless of RHTP continuation. This is the strongest sustainability path because the revenue does not depend on continued RHTP funding or state appropriations.
- Pathway 3: Commercial payer value-based contracts. Technology that supports outcome-based commercial contracts (readmission reduction, chronic disease outcomes) can be sustained through commercial value-based payment arrangements. Requires documented outcome data to support payer negotiations.
- Pathway 4: State appropriations. States that demonstrate RHTP-funded activities produce measurable state-level savings can appropriate state general fund support after 2030. Requires state-level policy advocacy starting Year 3 or Year 4 of the RHTP period.
- Pathway 5: Operating efficiency replacing grant subsidy. Technology that reduces operating cost (AI documentation reducing physician hours, RPM reducing readmissions, integrated EHR reducing administrative time) can sustain itself post-2030 by continuing to produce the operating savings that justified the original investment.
What CAHs should plan from Year 1:
- Structure RHTP investments with explicit sustainability pathway designation
- Build outcome measurement infrastructure that supports post-2030 payer and policy advocacy
- Integrate RHTP-funded technology into the Medicare Cost Report structure to enable ongoing cost-based recovery
- Avoid technology deployments that depend on continued RHTP funding for operations (these create a cliff in 2030)
How Mindbowser Helps CAHs Structure Technology for Financial Impact
Mindbowser builds healthcare technology that produces measurable financial impact at CAHs while meeting the structural constraints of cost-based reimbursement and state RHTP procurement.
- HealthConnect CoPilot delivers EHR integration and care coordination that captures margin in RCM, clinical documentation, and care coordination workflow categories. FHIR-native, designed for CAH operational constraints.
- WearConnect enables RPM infrastructure that generates new Medicare billing revenue (99453-99458) while supporting chronic disease outcomes for value-based payment contracts.
- AI SummaryAssist reduces physician documentation time by 40-55% , addressing the workforce cost category that cost-based reimbursement cannot solve alone.
- PHISecure covers HIPAA compliance posture and cybersecurity operations that protect CAH revenue from breach costs and regulatory penalties.
Engagement model:
- 12-16 week MVP builds aligned to state fiscal year procurement windows
- Investment structure designed for Medicare Cost Report compatibility from inception
- Sustainability planning built into Year 1 scope, not added later
- Operational handoff designed for 1-2 person CAH IT teams
CAHs receive Medicare reimbursement at 101% of allowable costs for inpatient and outpatient services provided to Medicare beneficiaries. This is called cost-based reimbursement and is codified at 42 CFR Part 485 Subpart F. Allowable costs include labor, supplies, utilities, depreciation on existing capital, and allocated administrative overhead. The CAH submits an annual Medicare Cost Report through CMS HCRIS documenting these costs. Medicare pays the documented costs plus 1% . This differs fundamentally from Prospective Payment System hospitals, which receive fixed DRG payments regardless of actual cost.
Cost-based reimbursement methodology, specifically Medicare reimbursement at 101% of Medicare-allowable costs. The methodology requires annual Medicare Cost Report submission, detailed cost allocation across Medicare and non-Medicare services, and compliance with Medicare cost accounting principles. Medicaid and commercial payer reimbursement follow separate methodologies negotiated state by state and contract by contract.
Yes. Cost-based reimbursement at 101% applies to both inpatient and outpatient services provided at the CAH to Medicare beneficiaries. This is different from some rural hospital designations that apply only to inpatient. The outpatient services provision is material because most CAH volume is outpatient.
The 72-hour rule at CAHs is commonly confused with the separate 96-hour average length of stay requirement. The 72-hour rule most often refers to Medicare’s three-day window rule, which requires certain outpatient services provided within 72 hours before inpatient admission to be bundled with the inpatient claim. This is a billing compliance rule distinct from the 96-hour average stay requirement for CAH designation. Some readers encounter “72 hour” when actually meaning “96 hour” (the CAH average stay rule). See our CAH definition and requirements guide for the full designation criteria.
CAHs do not generate significant profit in the traditional margin-expansion sense. Medicare cost-based reimbursement at 101% produces a small operating margin (1%) on Medicare services. Revenue from commercial and Medicaid patients, plus Medicare Advantage patients, is subject to negotiated rates that may fall below cost. About 40% of CAHs operate at a total loss in any given year despite cost-based Medicare protection. Technology investments that capture margin in categories cost-based reimbursement does not cover (denied claims recovery, new billable service line revenue, workforce retention) are increasingly the path to financial sustainability.
Not at the rate of deployment. Cost-based reimbursement covers depreciation on existing capital equipment, not new capital investment as it is incurred. A $500,000 technology deployment produces cost-report recovery of $500,000 / useful life per year, not $500,000 in year one. This is the structural reason CAHs have historically underinvested in technology and the reason RHTP funding (which provides grant capital) materially changes the CAH technology modernization equation in 2026-2030.
Medicare Advantage plans reimburse CAHs at rates negotiated with the plan, not at cost-based rates. As Medicare Advantage market share grows (currently 45-50% of Medicare beneficiaries nationally, growing), the share of CAH Medicare revenue subject to cost-based protection declines. This is a financial pressure point that CAH CFOs track closely. Policy advocacy continues on whether Medicare Advantage plans should reimburse CAHs on a cost basis.
Comprehensive technology modernization across RCM, clinical documentation AI, RPM, telehealth, and EHR integration typically produces $1M-$3M in combined annual margin impact at a CAH, realized over 2-3 years post-implementation. For a CAH with $25M annual revenue operating at 1-3% margin ($250K-$750K absolute), this represents a 130-400% margin improvement. The capital cost to deploy typically runs $300K-$800K, with payback in 14-24 months. RHTP grant funding in 2026-2030 can cover much of the upfront capital, accelerating the ROI timeline.