













 BLOGS
BLOGS  NEWSROOM
  CASE STUDIES
  WEBINARS
  PODCASTS
  ASSET HUB
  EVENT CALENDAR

















TL;DR
- Traditional FHIR-to-OMOP ETL build: $500K–1.8M, 9–12 months to implement, constant maintenance burden.
- Automated fragment-processing pipeline: $200K–400K, 3–4-week implementation, 90% reduction in ETL effort. Y1 ROI: ~276% with automated domain-based routing vs custom build.
- Anchor outcome: ThinkBio ran a 5-year continuous bulk FHIR research pipeline at research scale without manual ETL rebuild per update cycle. This page covers the ROI/cost angle. For architecture, see FHIR-to-OMOP on Databricks (architecture guide). For engineering depth, see Fragment Processing Deep Dive (engineering mechanics).
Healthcare organizations often underestimate the true cost of manual data transformation processes. A typical custom FHIR-to-OMOP ETL project involves far more than initial development it requires ongoing maintenance, quality assurance, and constant adaptation to changing healthcare standards.
Understanding the total cost of ownership reveals why automated approaches deliver such compelling returns on investment.
By the numbers: FHIR-to-OMOP build vs automate
| Metric | Traditional Custom ETL | Automated Fragment Processing |
|---|---|---|
| Implementation cost | $500K–1.8M | $200K–400K |
| Implementation timeline | 9–12 months | 3–4 weeks |
| Manual ETL effort | Baseline | 90% reduction |
| Maintenance burden | High (schema drift) | Low (domain routing absorbs drift) |
| Y1 ROI | — | ~276% |
Production cost-saving outcome
In one Mindbowser engagement, a financial-navigation platform serving cancer patients normalized data from four EHRs simultaneously (HL7v2 ADT/SIU, FHIR R4, custom CSV) without rebuilding per source resulting in a 90% reduction in manual data entry across Epic, Cerner, Athenahealth, and Meditech.
Instead, domain-based routing normalized all three feed types into a single internal schema without rebuilding the pipeline for each source.
Traditional ETL vs. Automated FHIR-to-OMOP
Development Phase (6-12 Months)
- Technical architects: $200K-400K in consulting fees
- ETL developers: $300K-600K for custom mapping logic
- Healthcare informaticists: $150K-300K for clinical validation
- Project management: $100K-200K for coordination
- Testing and validation: $150K-300K for quality assurance
- Total Development: $900K-1.8M
Ongoing Maintenance (Annual)
- Code maintenance: $200K-400K for updates and bug fixes
- Terminology updates: $100K-200K for vocabulary changes
- New requirement implementation: $150K-300K for additional mappings
- Quality monitoring: $100K-150K for data validation
- Performance optimization: $75K-150K for scaling improvements
- Total Annual Maintenance: $625K-1.2M
Hidden Costs
- Delayed research projects: Lost grant opportunities worth $500K-2M
- Manual data preparation: 200-400 hours per research study
- Data quality issues: Research delays and invalid conclusions
- Opportunity costs: IT resources diverted from strategic initiatives
Related Read: Getting Your Architecture FHIR Ready: A Step-by-Step Guide
Automated FHIR-to-OMOP: The Investment
Implementation Costs (4-6 Weeks)
- Platform setup: $50K-100K for infrastructure configuration
- Custom mappings: $75K-150K for organization-specific requirements
- Testing and validation: $50K-100K for quality assurance
- Training and documentation: $25K-50K for knowledge transfer
- Total Implementation: $200K-400K
Operational Costs (Annual)
- Platform subscription: $50K-150K for cloud services
- Monitoring and support: $25K-75K for ongoing management
- Updates and enhancements: $25K-50K for platform improvements
- Total Annual Operations: $100K-275K
Year 1 ROI Analysis
Cost Comparison
Traditional Approach:
Development: $900K-1.8M
Year 1 Maintenance: $625K-1.2M
Total Year 1: $1.525M-3M
Automated Approach:
Implementation: $200K-400K
Year 1 Operations: $100K-275K
Total Year 1: $300K-675K
Year 1 Savings: $1.225M-2.325M
ROI Calculation
ROI = (Savings – Investment) / Investment × 100%
Conservative: ($1.225M – $300K) / $300K = 308%
Aggressive: ($2.325M – $675K) / $675K = 244%
Average Year 1 ROI: ~276% (Mindbowser modeled estimate conservative, aggressive, and average scenarios detailed below)
Quantifying Business Benefits
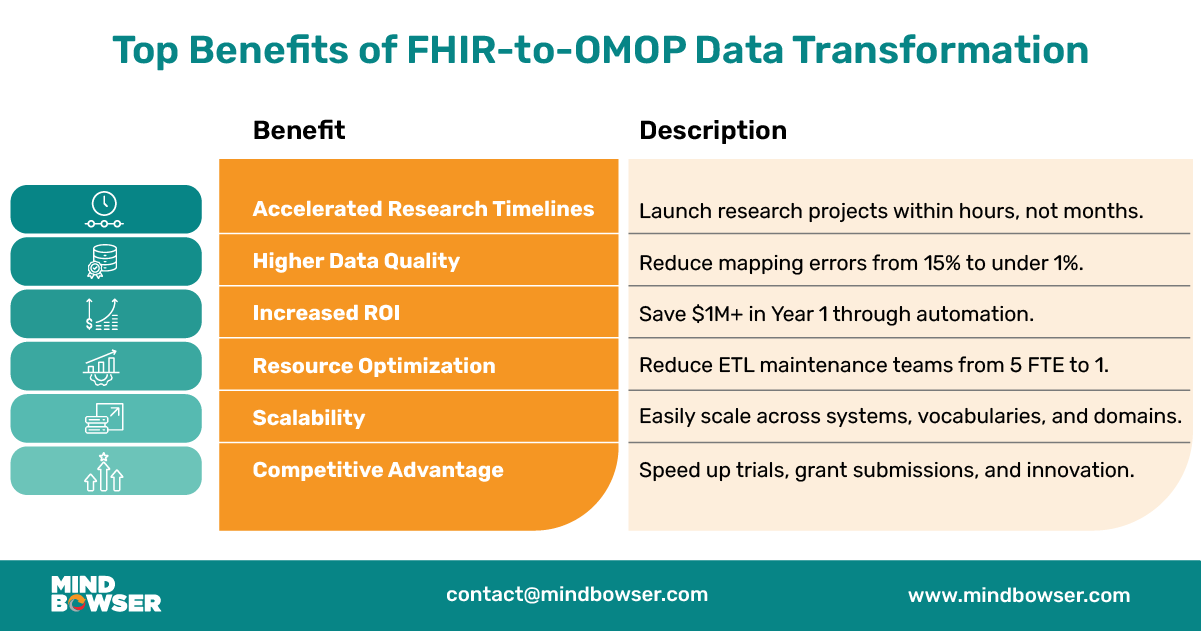
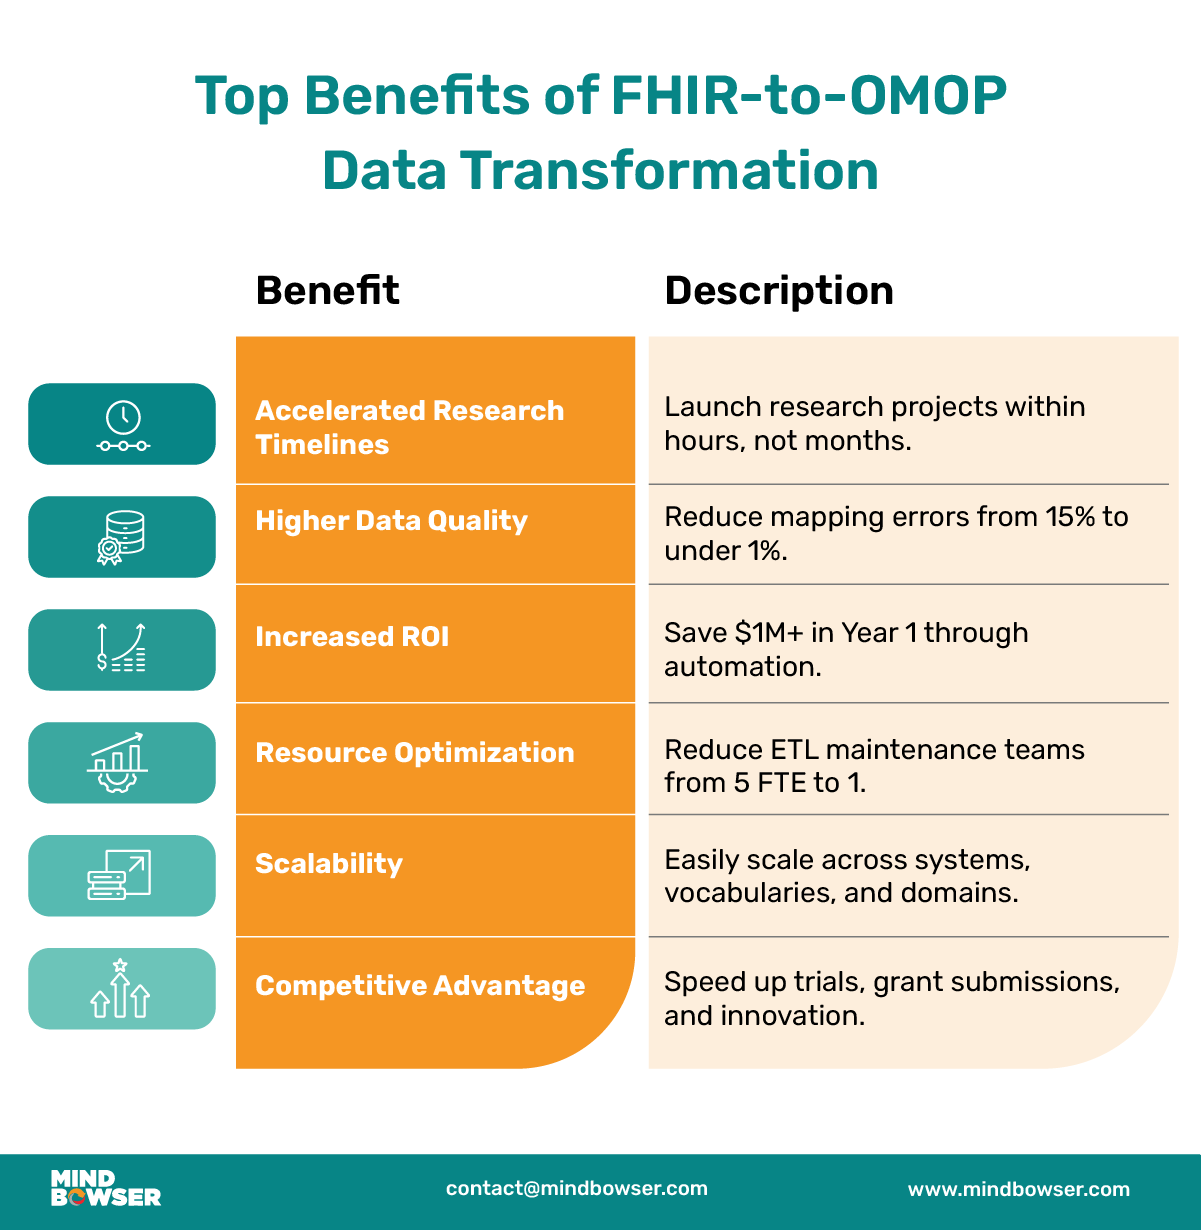
Accelerated Research Timeline
Traditional: 6-12 months for data preparation before research can begin Automated: Research-ready data available within hours of processing
Value Impact:
- Clinical trials: 6-month faster patient recruitment = $2M-5M value
- Grant applications: Earlier submission cycles increase funding probability
- Publication speed: Faster time-to-publication improves academic rankings
Improved Data Quality
Traditional: Manual mapping introduces 5-15% error rates Automated: Standardized vocabulary mapping achieves <1% error rates
Value Impact:
- Research validity: Reduced need to discard studies due to data quality
- Regulatory compliance: Fewer audit findings and remediation costs
- Publication acceptance: Higher-quality data improves peer review success
IT Resource Optimization
Traditional: 3-5 FTE dedicated to ETL maintenance and updates Automated: 0.5-1 FTE for monitoring and administration
Value Impact:
- Resource reallocation: $400K-800K in FTE costs redirected to strategic projects
- Skill development: IT teams focus on advanced analytics rather than data plumbing
- Innovation capacity: Freed resources enable new digital health initiatives
Multi-Year Value Creation
Year 2-3 Benefits
The automated approach’s value compounds over time:
- Year 2 Savings:
Traditional Maintenance:$625K-1.2M
Automated Operations:$100K-275K
Net Savings:$525K-925K
- Year 3 Savings:
Traditional Maintenance:$625K-1.2M
Automated Operations:$100K-275K
Net Savings:$525K-925K
- 3-Year Total Savings: $2.275M-4.175M
3-Year Investment:$500K-925K
3-Year ROI:355-351%
Scalability Benefits
Automated systems scale more efficiently:
- Additional data sources: 80% less effort to integrate new EHR systems
- New research domains: Vocabulary expansion without code changes
- Volume growth: Auto-scaling handles 10x data increases without re-architecture
Talk to Our FHIR-to-OMOP Team About Your Pipeline ROI
Book a personalized demo to explore how automated data transformation can save your organization millions.
Risk-Adjusted ROI
Conservative planning should account for implementation risks:
Risk Factors
- Integration complexity: 15-30% budget variance for complex Epic configurations
- Change management: 10-20% additional training costs for user adoption
- Performance optimization: 5-15% additional tuning for large-scale deployments
Risk-Adjusted Calculation
Base Investment: $200K-400K
Risk Buffer (25%): $50K-100K
Adjusted Investment: $250K-500K
Conservative ROI: ($1.225M – $500K) / $500K = 145%
Even with substantial risk buffers, automated approaches deliver 145%+ first-year returns.Competitive Advantage Quantification
Research Productivity
Organizations with automated pipelines report:
- 3x more research studies initiated annually
- 50% faster grant application cycles
- 60% improvement in cohort identification speed
- 40% reduction in research study startup time
Revenue Impact
- Clinical trials: Faster patient recruitment increases trial participation revenue
- Grant funding: Improved data infrastructure strengthens grant applications
- Population health contracts: Better analytics support value-based care contracts
- Academic partnerships: Enhanced research capabilities attract collaboration opportunities
Implementation Strategy for Maximum ROI
Phase 1: Quick Wins (Weeks 1-4)
Focus on highest-value, lowest-risk implementations:
- Core clinical tables: Person, visit, condition, drug exposure
- Most common vocabularies: SNOMED, LOINC, RxNorm
- Primary research use cases: Patient cohort identification
Phase 2: Expanded Scope (Weeks 5-8)
Add complexity incrementally:
- Additional OMOP tables: Measurement, procedure, observation
- Advanced vocabularies: ICD-10, CPT, local code systems
- Quality metrics: Population health measures and outcomes
Phase 3: Advanced Analytics (Weeks 9-12)
Enable sophisticated research capabilities:
- Derived tables: Drug era, condition era, cohort definitions
- Machine learning features: Risk scores, prediction models
- Real-time processing: Operational analytics and alerts
Quick wins to long-term scalability with the FHIR-to-OMOP model.
Measuring Success
Key Performance Indicators
- Time-to-research: Days from data request to analysis-ready dataset
- Data quality scores: Completeness, accuracy, and consistency metrics
- Research throughput: Number of studies supported annually
- Cost per study: Total pipeline costs divided by research projects enabled
FHIR-to-OMOP automation is driving best-in-class performance across top healthcare institutions.
Success Benchmarks
Leading organizations achieve:
- <24 hours: Time from Epic export to research-ready OMOP data
- >95% data completeness across core clinical domains
- >99% processing reliability with automated error handling
- <$10K per research study in data preparation costs
Financial Planning Considerations
Budget Allocation
- 60% implementation: Platform setup and initial configuration
- 25% operations: First-year cloud services and support
- 15% contingency: Risk buffer for unexpected requirements
Funding Sources
- IT capital budget: Infrastructure and platform costs
- Research grants: Many funding agencies support data infrastructure
- Quality improvement funds: Population health analytics investments
- Revenue cycle: ROI from improved clinical trial participation
How Fragment Processing Fits Into FHIR-to-OMOP Analytics
The cost savings in this analysis assume the FHIR extraction step is already handled, the part where your source systems (Epic, Cerner, Athenahealth, Meditech) push usable FHIR bulk exports in the first place. In Mindbowser’s implementations, that upstream step runs through ConnectHealth, our healthcare integration platform.
ConnectHealth pulls structured FHIR exports from 20+ EHRs and uses Helix AI to handle the resource mapping in plain English so the fragment-processing pipeline receives clean, consistently structured data rather than raw scrapes. That is where the 90% ETL reduction figure comes from: the upstream normalization removes the hand-coding that accounts for most of the $900K–1.8M traditional build cost.
FHIR fragment processing is one part of a larger healthcare data transformation pipeline. Once fragmented FHIR resources are parsed, normalized, and validated, the next step is to map them into an analytics-ready structure that supports cohort analysis, outcomes research, quality reporting, and population health use cases.
For many healthcare organizations, that destination model is OMOP. OMOP helps standardize clinical concepts across systems, making it easier for data teams, researchers, and analytics leaders to work with consistent longitudinal data across EHRs, claims, labs, and other clinical sources.
Fragment processing matters because poor handling of FHIR resources can create downstream mapping issues, duplicate records, incomplete patient timelines, and unreliable analytics. A well-designed pipeline should preserve clinical meaning, validate terminology, and maintain traceability from the original FHIR resource through the OMOP model.
Read the broader guide on FHIR to OMOP conversion for healthcare analytics to understand how fragment processing connects with mapping, normalization, validation, and downstream analytics workflows.
Data engineering note: FHIR-to-OMOP pipelines require more than format conversion. Teams need ingestion design, terminology mapping, data quality checks, lineage, PHI-aware access controls, and cloud-ready transformation workflows. Mindbowser helps healthcare teams build these foundations for reliable analytics and research use cases.
Conclusion: The Imperative for Automation
The ROI case for automated FHIR-to-OMOP transformation is compelling across multiple dimensions:
- Financial returns: 200-400% first-year ROI with continuing benefits
- Strategic advantage: Faster research cycles and improved data quality
- Operational efficiency: Reduced IT burden and improved resource allocation
- Risk mitigation: Standardized processes and automated quality controls
Healthcare organizations that delay automation risk falling behind competitors who can rapidly convert clinical insights into research breakthroughs and evidence-based care improvements.
The question isn’t whether to automate healthcare data transformation—it’s how quickly you can realize the benefits.
R4. It’s the first normative FHIR version (released 2019) and the regulatory baseline required by ONC’s 21st Century Cures Act and CMS’s interoperability mandates. R5 (published 2023) is available but most commercial EHRs are still on R4, so building to R4 + US Core 4.0.0 profile gives the widest compatibility today.
Automated pipelines typically run $200K–$400K for implementation plus $100K–$275K per year in operations, compared to $900K–$1.8M upfront and $625K–$1.2M annually for custom ETL builds. These ranges are based on Mindbowser implementation benchmarks and vary by the number of source EHRs, data volume, and OMOP domain coverage required.
Automated fragment-processing pipelines complete in 4–6 weeks. Traditional custom ETL takes 9–12 months. The difference is primarily in the mapping step: automated tools handle FHIR resource-to-OMOP table routing that custom builds hand-code.
Based on Mindbowser implementation models: Year 1 ROI averages ~276% against a $300K–$675K total investment (implementation + first-year operations). The three-year ROI reaches 351–355% as savings compound. The primary driver is eliminating the 3–5 FTE traditionally dedicated to ETL maintenance, freeing $400K–$800K in annual IT costs.