BLOGS
BLOGS  NEWSROOM
  CASE STUDIES
  WEBINARS
  PODCASTS
  ASSET HUB
  EVENT CALENDAR


TL;DR
- Static thresholds generate 80-90% false alarm rates because they compare every patient to a population average.
- Personalized baselines use ML to learn each patient’s physiological normal over 14-30 days, then flag deviations from that individual pattern.
- Biofourmis Biovitals (FDA 510(k) cleared) achieves 93% deterioration prediction accuracy with 21-hour warning, compared to NEWS2 at 64% (Biofourmis).
- BRI Network 2026 data shows 24-48 hour prediction windows using personalized models. RPMCheck AI implements this pattern with 60-80% false alarm reduction. The architecture shift: from “is this reading abnormal?” to “is this reading abnormal for this patient?”
We deployed static SpO2 thresholds on a 200-patient COPD RPM program and watched the false alarm rate hit 83% by week six.
The threshold was set at 90%. Clinically reasonable as a population default. But 37 of our 200 COPD patients had baseline SpO2 between 87% and 91% because of advanced disease. Those 37 patients generated alerts every single day. By week three, the care managers had mentally categorized them as “chronic alerters” and stopped reviewing their readings. By week six, one of those patients had a genuine deterioration (SpO2 dropped from baseline 89% to 82% over 72 hours), and it was caught late because the alert looked identical to every other daily false alarm from that patient.
That incident changed how we approach RPM alert architecture. The static threshold was not wrong in absolute terms. SpO2 below 90% is concerning for a healthy adult. It was wrong for 37 specific patients, and being wrong for 37 patients generated enough noise to bury a real emergency.
The fix was not lowering the threshold or raising it. The fix was asking a different question entirely.
Why Static Thresholds Fail at Scale
Static thresholds apply one number to every patient. SpO2 below 90%. Blood pressure above 140/90. Weight gain above 2 pounds in 24 hours. Heart rate above 100.
Each threshold is clinically defensible as a population-level screen. The problem emerges at the intersection of population thresholds and individual physiology.
Patient baselines follow a distribution. In a 200-patient COPD panel, SpO2 baselines might range from 85% to 97%. Set the threshold at 90% and every patient below that baseline generates daily false alarms. Set it at 85% and you miss subtle deterioration in patients with higher baselines who drop from 95% to 90% (a clinically significant 5-point drop that never crosses the threshold).
There is no static number that works for both ends of the distribution simultaneously. This is not a calibration problem. It is a fundamental limitation of the approach.
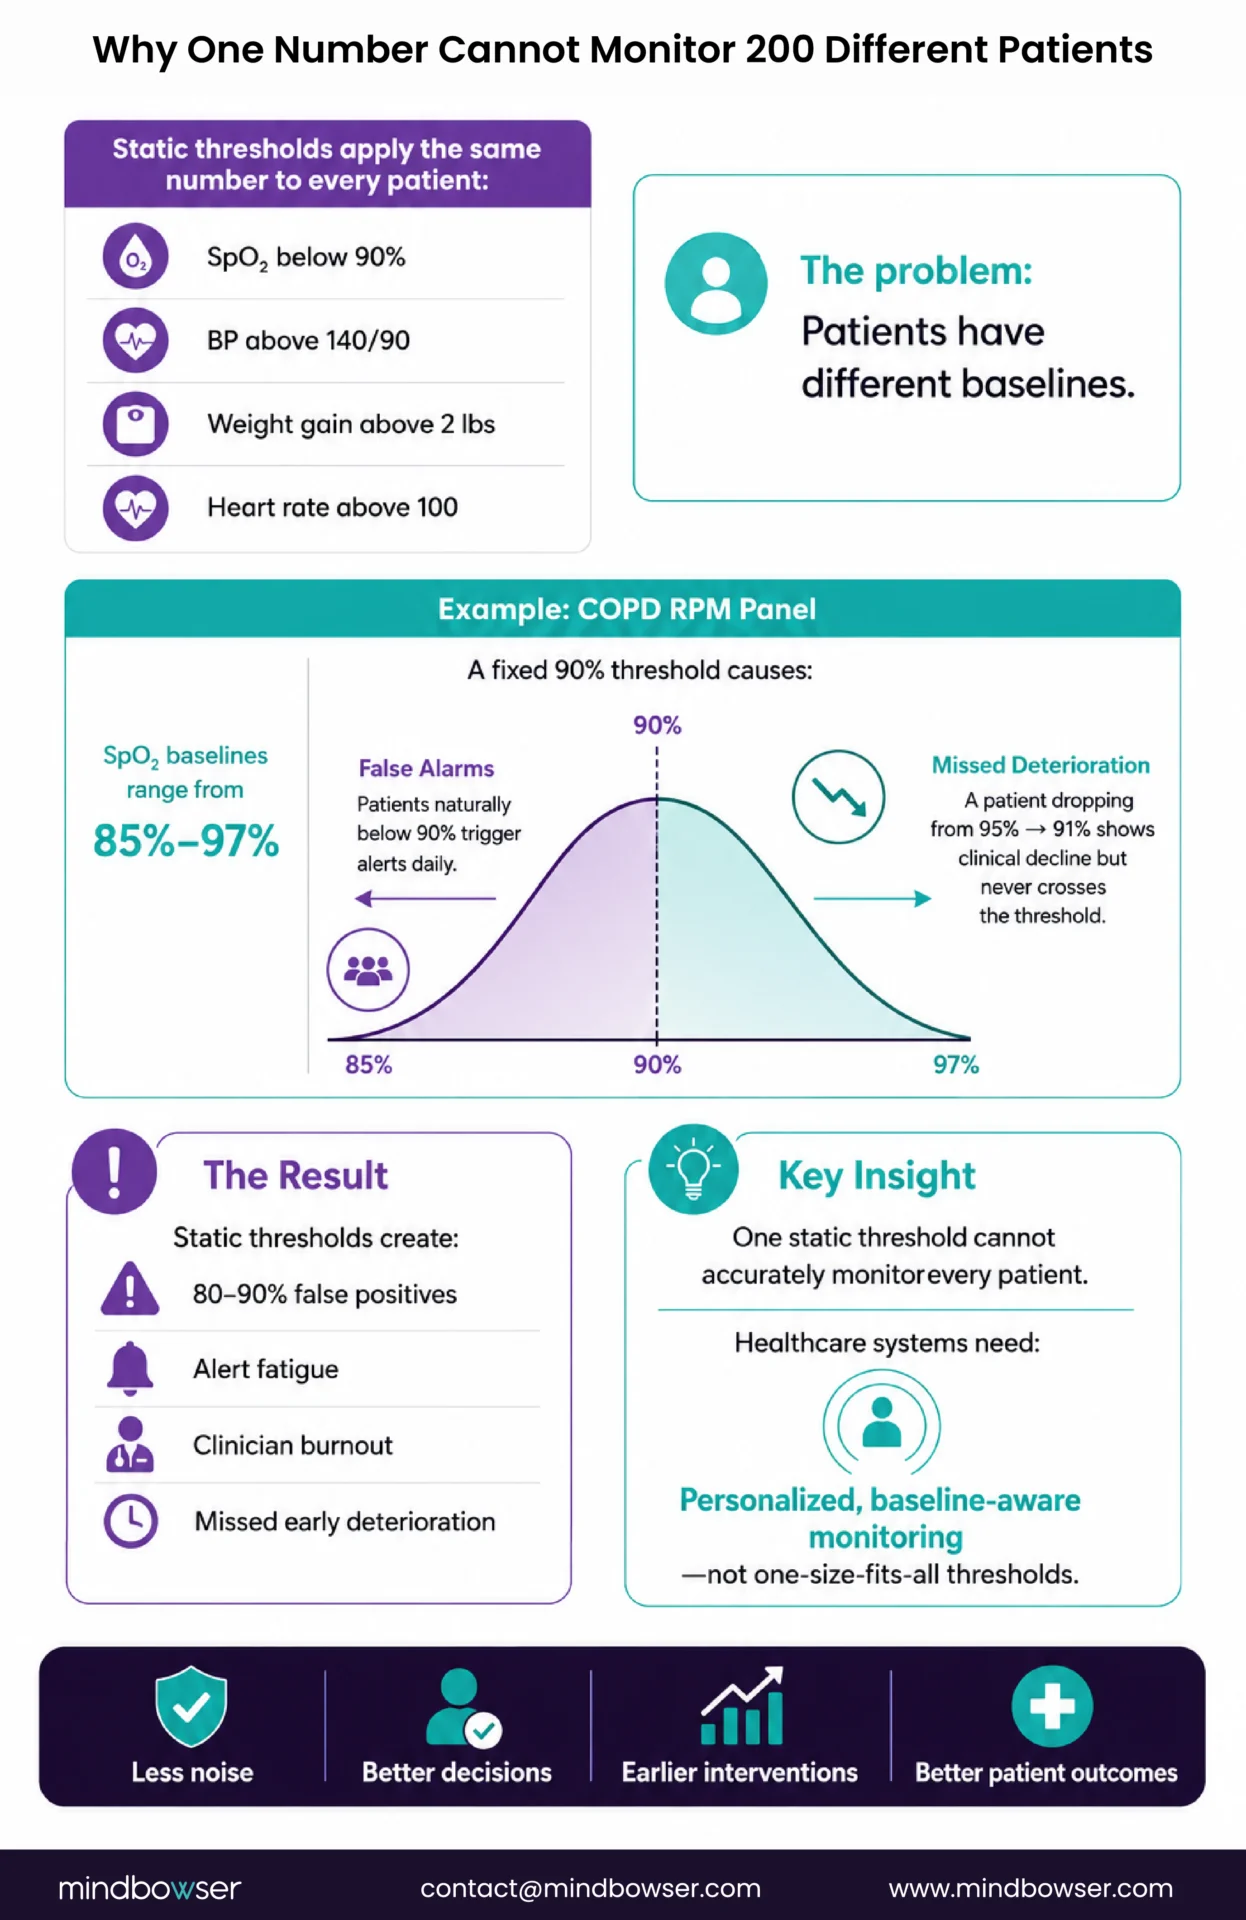
The PMC 2025 scoping review documented false-positive rates of 80-90% in clinical monitoring environments using static thresholds. At the BRI Network’s 2026 summit, which our founder Ayush Jain attended, Nicole Speeny’s presentation on clinician burnout through RPM workflows made the connection explicit: care teams do not burn out from patient care. They burn out from triaging noise generated by thresholds that don’t account for individual variation.
For the full downstream impact of false alarms on RPM programs, see our alert fatigue guide.
What Are Personalized Baselines?
Personalized baselines are ML models that learn what is physiologically normal for each patient. Instead of comparing a reading to a population threshold, the system compares it to that patient’s own history.
The training period. During the first 14-30 days of RPM enrollment, the system collects vital sign readings without generating ML-based alerts. Static thresholds remain active as a safety net during this period (catching critical values that no system should miss, regardless of individual baseline). The ML model observes and learns: what is this patient’s typical SpO2 range? What is their morning vs evening blood pressure pattern? What is their normal resting heart rate? How much does their weight fluctuate day to day?
After training. The system has built a statistical profile for each patient. Patient A: SpO2 averages 94.2% with a standard deviation of 1.1%. Patient B: SpO2 averages 88.7% with a standard deviation of 0.9%.
A reading of 90% SpO2 is now evaluated differently:
Patient A (baseline 94.2%, SD 1.1%): 90% is 3.8 standard deviations below their mean. That is a statistically significant deviation. Alert fires. The care manager calls.
Patient B (baseline 88.7%, SD 0.9%): 90% is 1.4 standard deviations above their mean. This is a better-than-average day for Patient B. No alert. No noise.
Same reading. Opposite clinical meaning. Opposite system response. That is what personalization produces.
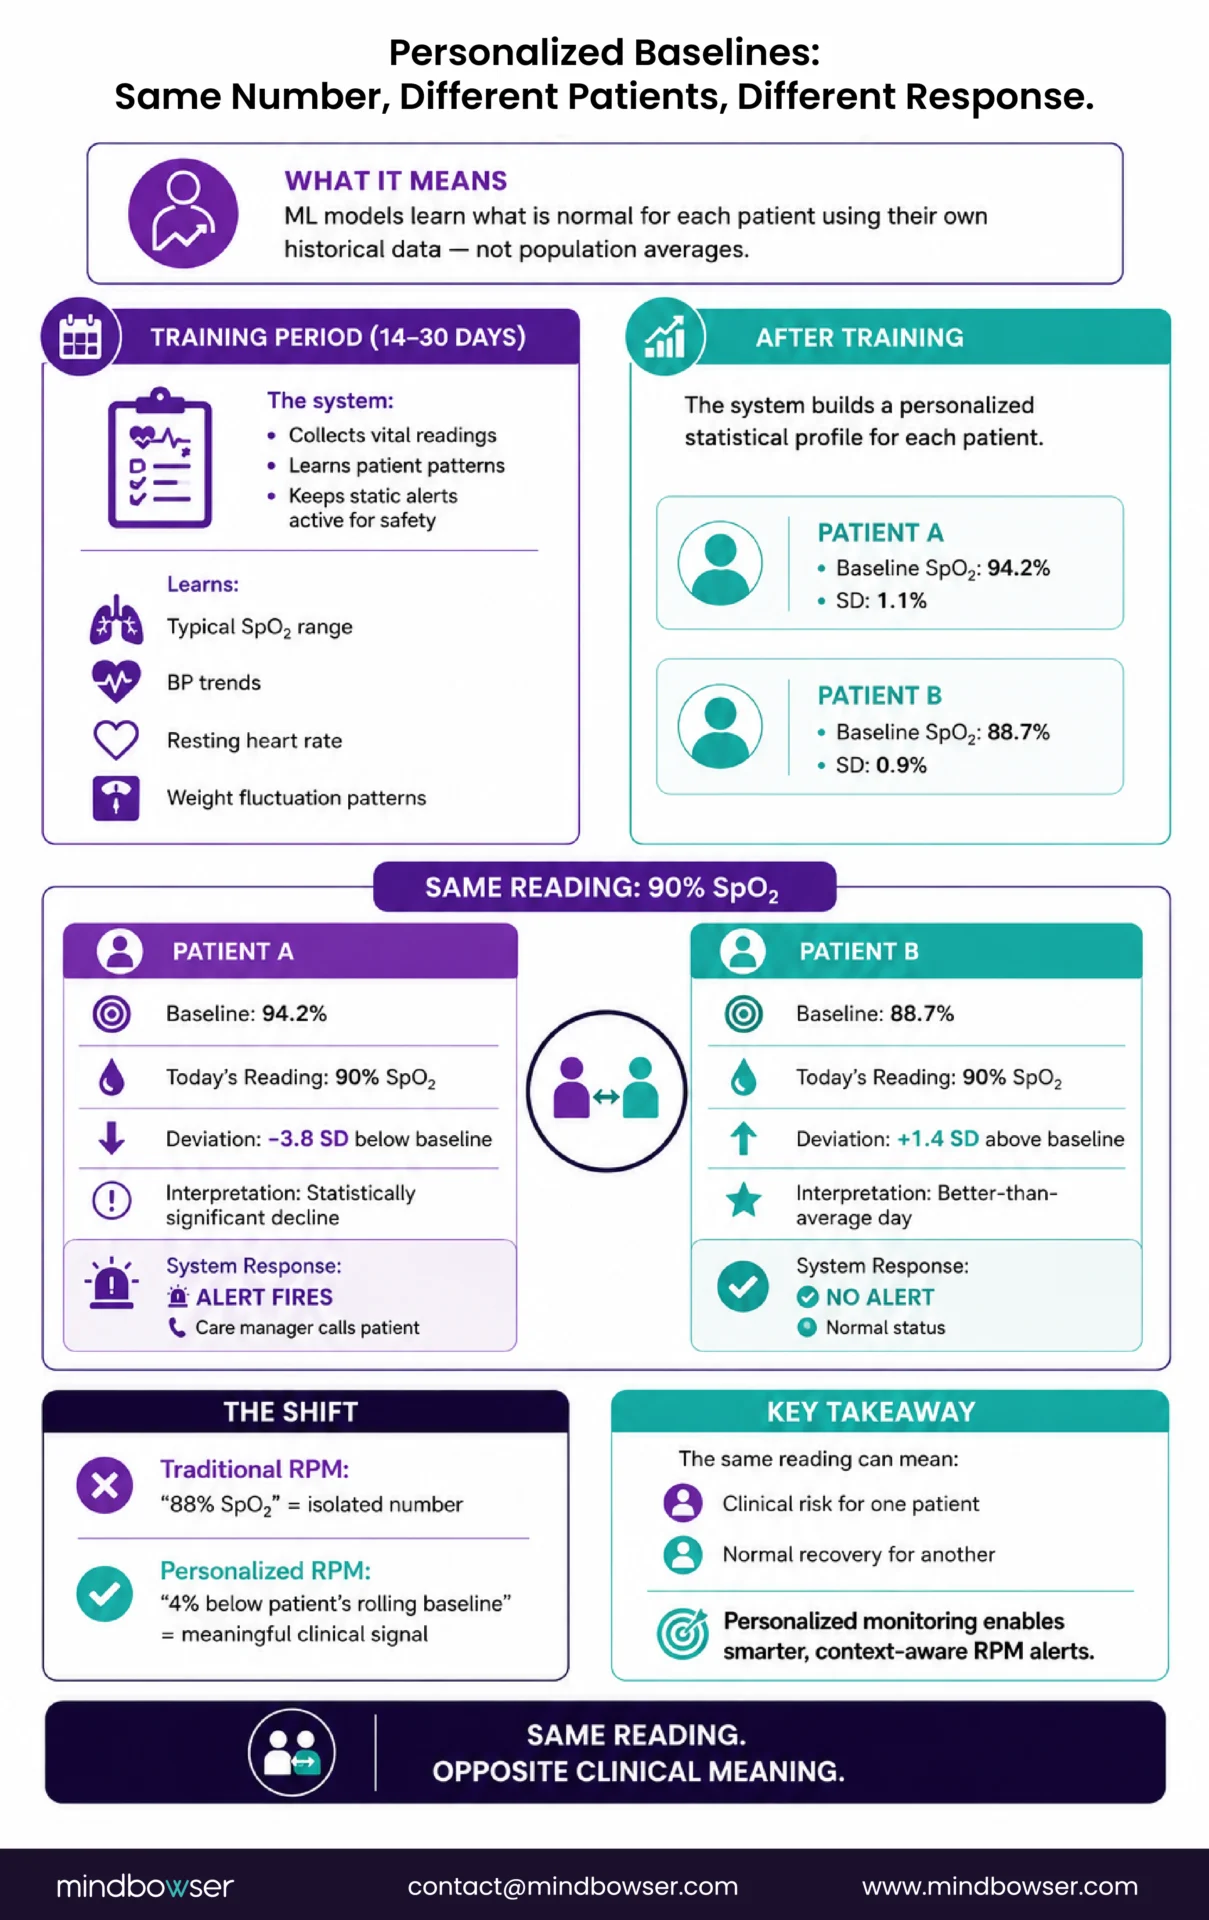
The architectural shift is from absolute values to relative deviation. “88% SpO2” is a number without clinical context. “4% below patient’s 14-day rolling mean with downward slope over 48 hours” is a clinical signal. The second statement requires knowing the patient’s baseline. That is what the ML model provides.
How Does the ML Architecture Actually Work?
The architecture has four layers. Each layer adds sophistication, but the clinical value starts at layer one.
Layer 1: Statistical Process Control (SPC).
The simplest and most interpretable approach. Calculate each patient’s rolling mean and standard deviation over a 14-30 day window. Flag any reading that falls outside 2-3 standard deviations from their personal mean.
This is not deep learning. It is basic statistics applied per patient instead of per population. And it captures roughly 70% of the value of personalized monitoring. A care team that switches from static thresholds to patient-specific SPC will see immediate false alarm reduction because the system stops alerting on patients whose normal range falls below (or above) the population threshold.
We recommend starting here. SPC is explainable (the care manager understands “3 standard deviations from patient’s normal”), fast to implement (hours, not weeks), and requires no specialized ML infrastructure.
Layer 2: Multi-vital composite scoring.
Single-vital alerts are the root of most false alarms. SpO2 drops 2% from baseline? That alone might be a normal fluctuation. But SpO2 drops 2% AND respiratory rate increases 4 breaths/min AND activity level decreases 25% over the same 48-hour window? That composite pattern is a deterioration signal with high confidence.
Composite scoring combines multiple vital sign deviations into a single risk score. The score weights each deviation by clinical significance and considers temporal correlation (changes happening simultaneously are more concerning than changes at different times).
Layer 3: Time-series anomaly detection.
Isolation Forest and LSTM (Long Short-Term Memory) networks detect patterns in the temporal sequence of readings that statistical methods miss. A gradual slope (SpO2 declining 0.5% per day for 6 days) is invisible to SPC until day 6 when the cumulative decline triggers the deviation threshold. An LSTM trained on the patient’s time series detects the slope by day 3 because it models the trajectory, not just the current deviation.
LSTM models are more powerful but less interpretable. They detect patterns SPC cannot, but explaining “the LSTM flagged this patient” to a care manager requires translating the model output into clinical language: “SpO2 has been declining 0.5% per day for 4 days with no plateau.”
Layer 4: Inter-patient pattern matching.
The most advanced approach: compare this patient’s current trajectory to similar patients who previously deteriorated. “Patient A’s vital sign pattern over the past 72 hours is similar to the patterns of 14 other patients who were hospitalized within 5 days.” This is the Digital Twin direction. Not yet in production at scale, but the approach Biofourmis is developing and academic labs are publishing on.
The clinical constraint across all layers: explainability.
A model that outputs “high risk” without explanation is useless to a care manager. Every alert must explain WHY: which vital signs deviated, by how much, over what timeframe, and what the trend direction is. The care manager must be able to look at the alert, look at the data, and agree or disagree with the assessment. Black-box risk scores erode clinical trust faster than false alarms do.
Deploy AI-powered anomaly detection on your existing RPM platform
What Does Biofourmis Biovitals Set as the Benchmark?
Biofourmis is the market benchmark for personalized RPM AI. Their Biovitals Analytics Engine received FDA 510(k) clearance for ambulatory physiologic monitoring, making it the first FDA-cleared AI engine specifically designed for personalized baseline detection in remote patient monitoring.
- Performance: 93% deterioration prediction accuracy with an average prediction time of 21 hours before clinical events. For comparison, the NEWS2 scoring system (the standard clinical early warning score used in hospitals) achieves 64% accuracy. That is a 29-percentage-point improvement in prediction accuracy with nearly a full day of warning.
- How it works: Biofourmis collects data from medical-grade wearable sensors at a rate of 20+ physiological signals per second. The Biovitals engine creates unique digital biomarkers for each patient, establishes a personalized physiological baseline, and continuously monitors for clinically meaningful fluctuations. When the deviation pattern matches a deterioration signature, the system alerts the care team.
- Hospital@Home application: Biofourmis rolled out the Biovitals Hospital@Home platform nationally for CMS AHCAH programs. The combination of personalized baselines with continuous monitoring makes Biofourmis the most clinically validated AI layer in the hospital-at-home space (see our hospital at home RPM guide).
- What this means for the market: Biofourmis proved that personalized baseline monitoring works clinically, is FDA-clearable, and produces outcomes that static thresholds cannot match. The 93% accuracy benchmark is the number every RPM AI implementation is measured against.
Biofourmis is a full-platform company: they provide the wearable devices, the AI engine, the clinical dashboard, and the care delivery services. For health systems that want the Biofourmis platform, the platform is commercially available. For organizations building custom RPM platforms that want to own the AI layer, Biofourmis is the reference architecture, not the component.
What Does RPMCheck AI Do?
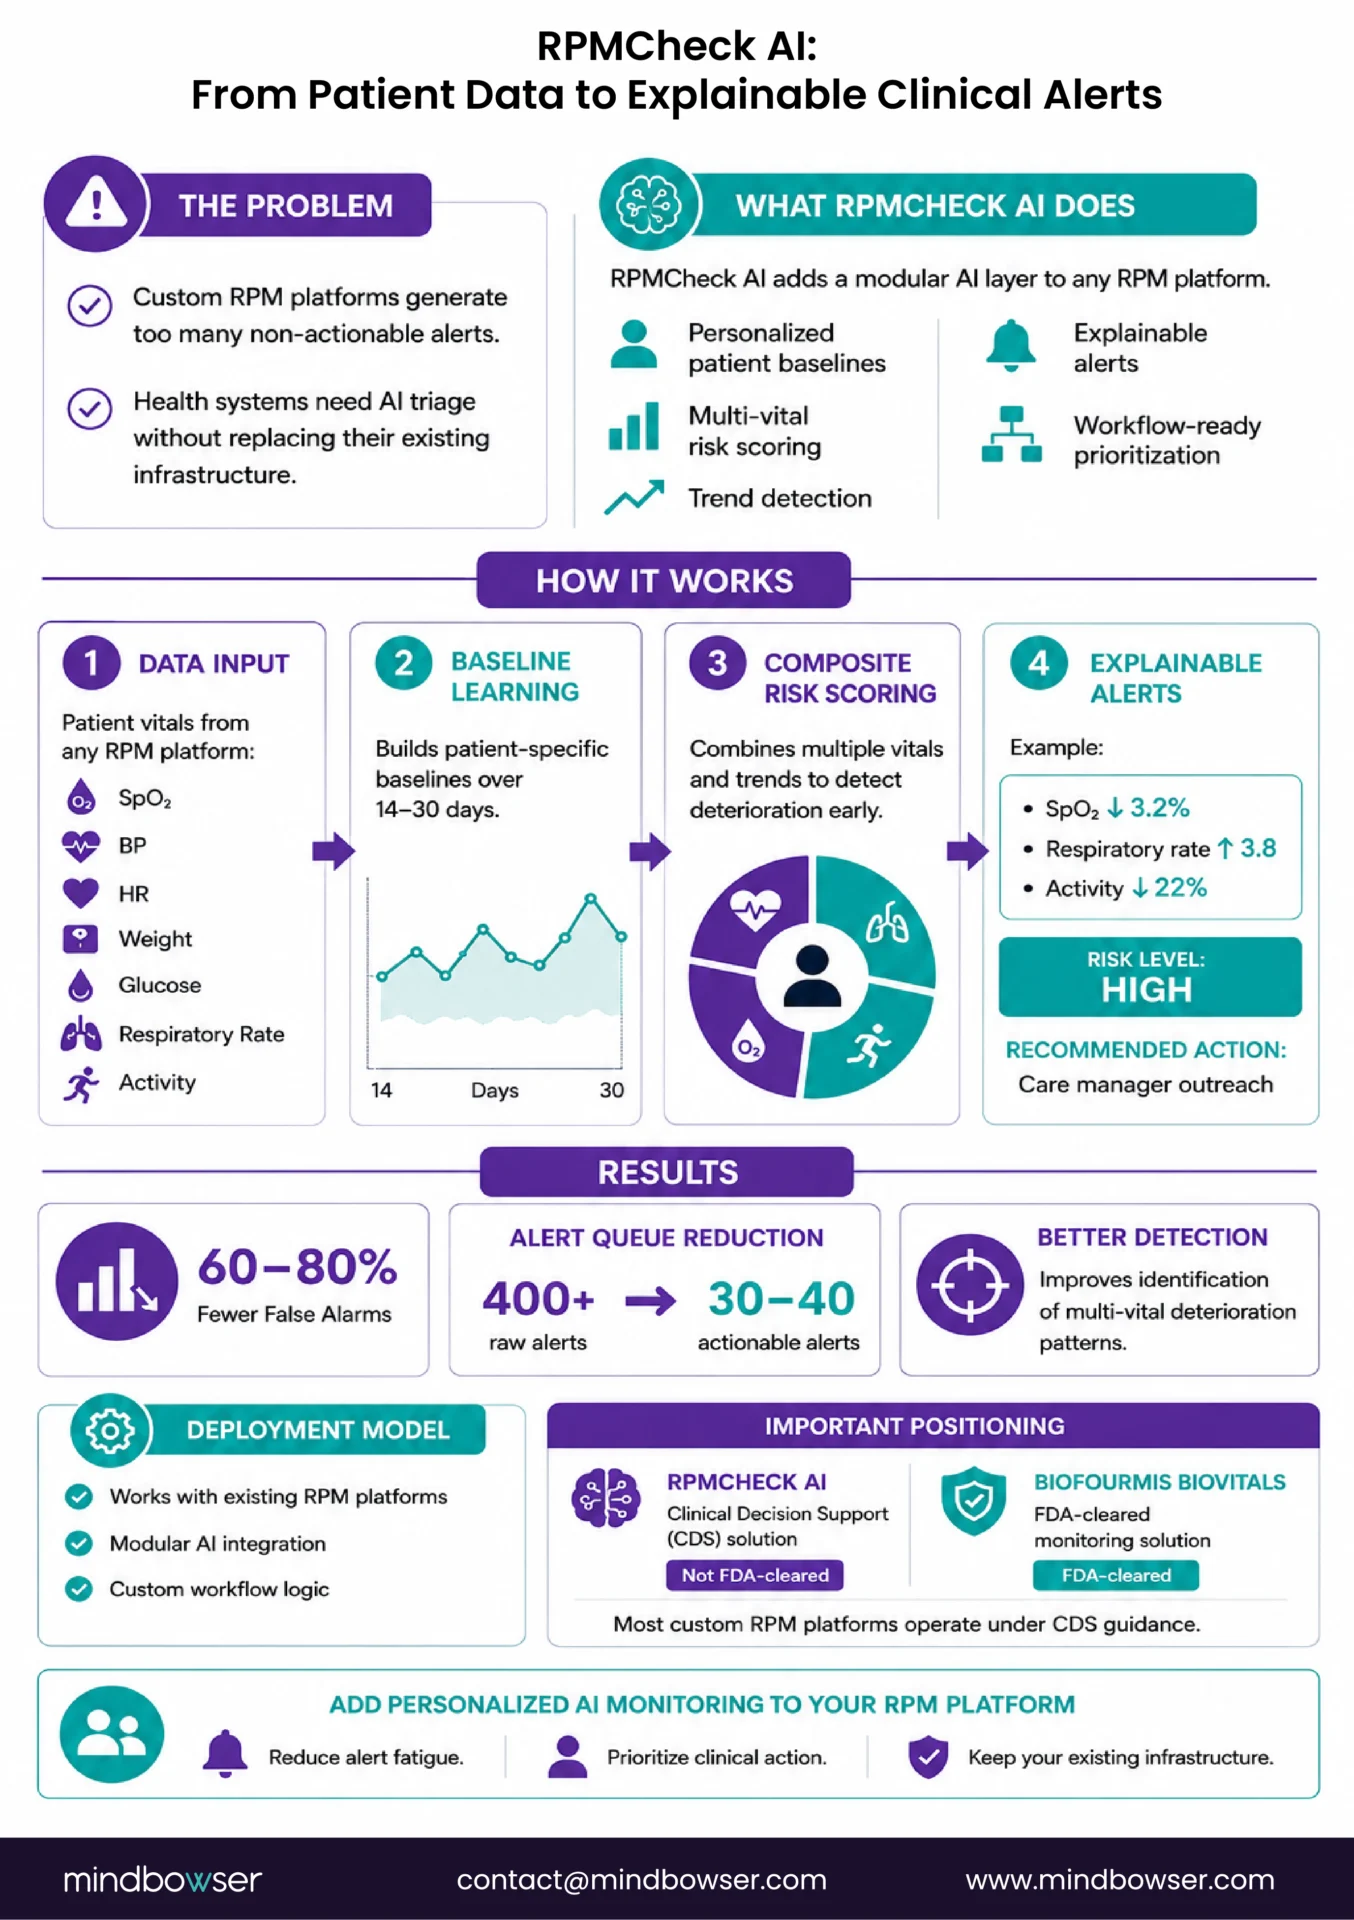
The problem RPMCheck AI addresses: health systems building custom RPM platforms need an AI triage layer but do not want to adopt a full vendor platform. They want to own the technology, customize the alert logic for their clinical workflows, and integrate the AI into their existing monitoring infrastructure.
The capability: personalized anomaly detection that deploys as a modular layer on top of any RPM platform. RPMCheck AI trains on individual patient vital sign data, builds patient-specific baseline profiles, generates composite risk scores across multiple data streams, and delivers explainable alerts with deviation magnitude, trend direction, and contributing factors.
Implementation approach:
- Input: time-series vital sign data per patient from any RPM platform (SpO2, BP, HR, weight, glucose, respiratory rate, activity)
- Processing: SPC-based baseline per patient (Layer 1) plus composite scoring across vitals (Layer 2) plus temporal trend detection (Layer 3)
- Output: green/yellow/red risk classification per patient with explainable reasoning. The alert says “SpO2 dropped 3.2% from 14-day baseline of 93.4%, respiratory rate increased 3.8 breaths/min from baseline of 16.2, activity decreased 22% from 7-day average. Composite risk: high. Recommended: care manager call to assess respiratory status”
- Results: 60-80% false alarm reduction across deployments. The care team’s alert queue shifts from 400 undifferentiated items to 30-40 actionable items. True positive detection rate remains the same or improves because composite scoring catches multi-vital deterioration patterns that single-vital static thresholds miss.
- Honest positioning: RPMCheck AI is not FDA-cleared. Biofourmis Biovitals is. For programs requiring FDA-cleared AI as a standalone diagnostic or monitoring device, Biofourmis is currently the option. For programs where the AI functions as clinical decision support within a broader platform (not a standalone diagnostic device), FDA clearance of the AI component is not required under current CDS guidance from the FDA. Most custom RPM platforms fall into the CDS category.
How Do You Implement Personalized Baselines in an Existing Program?
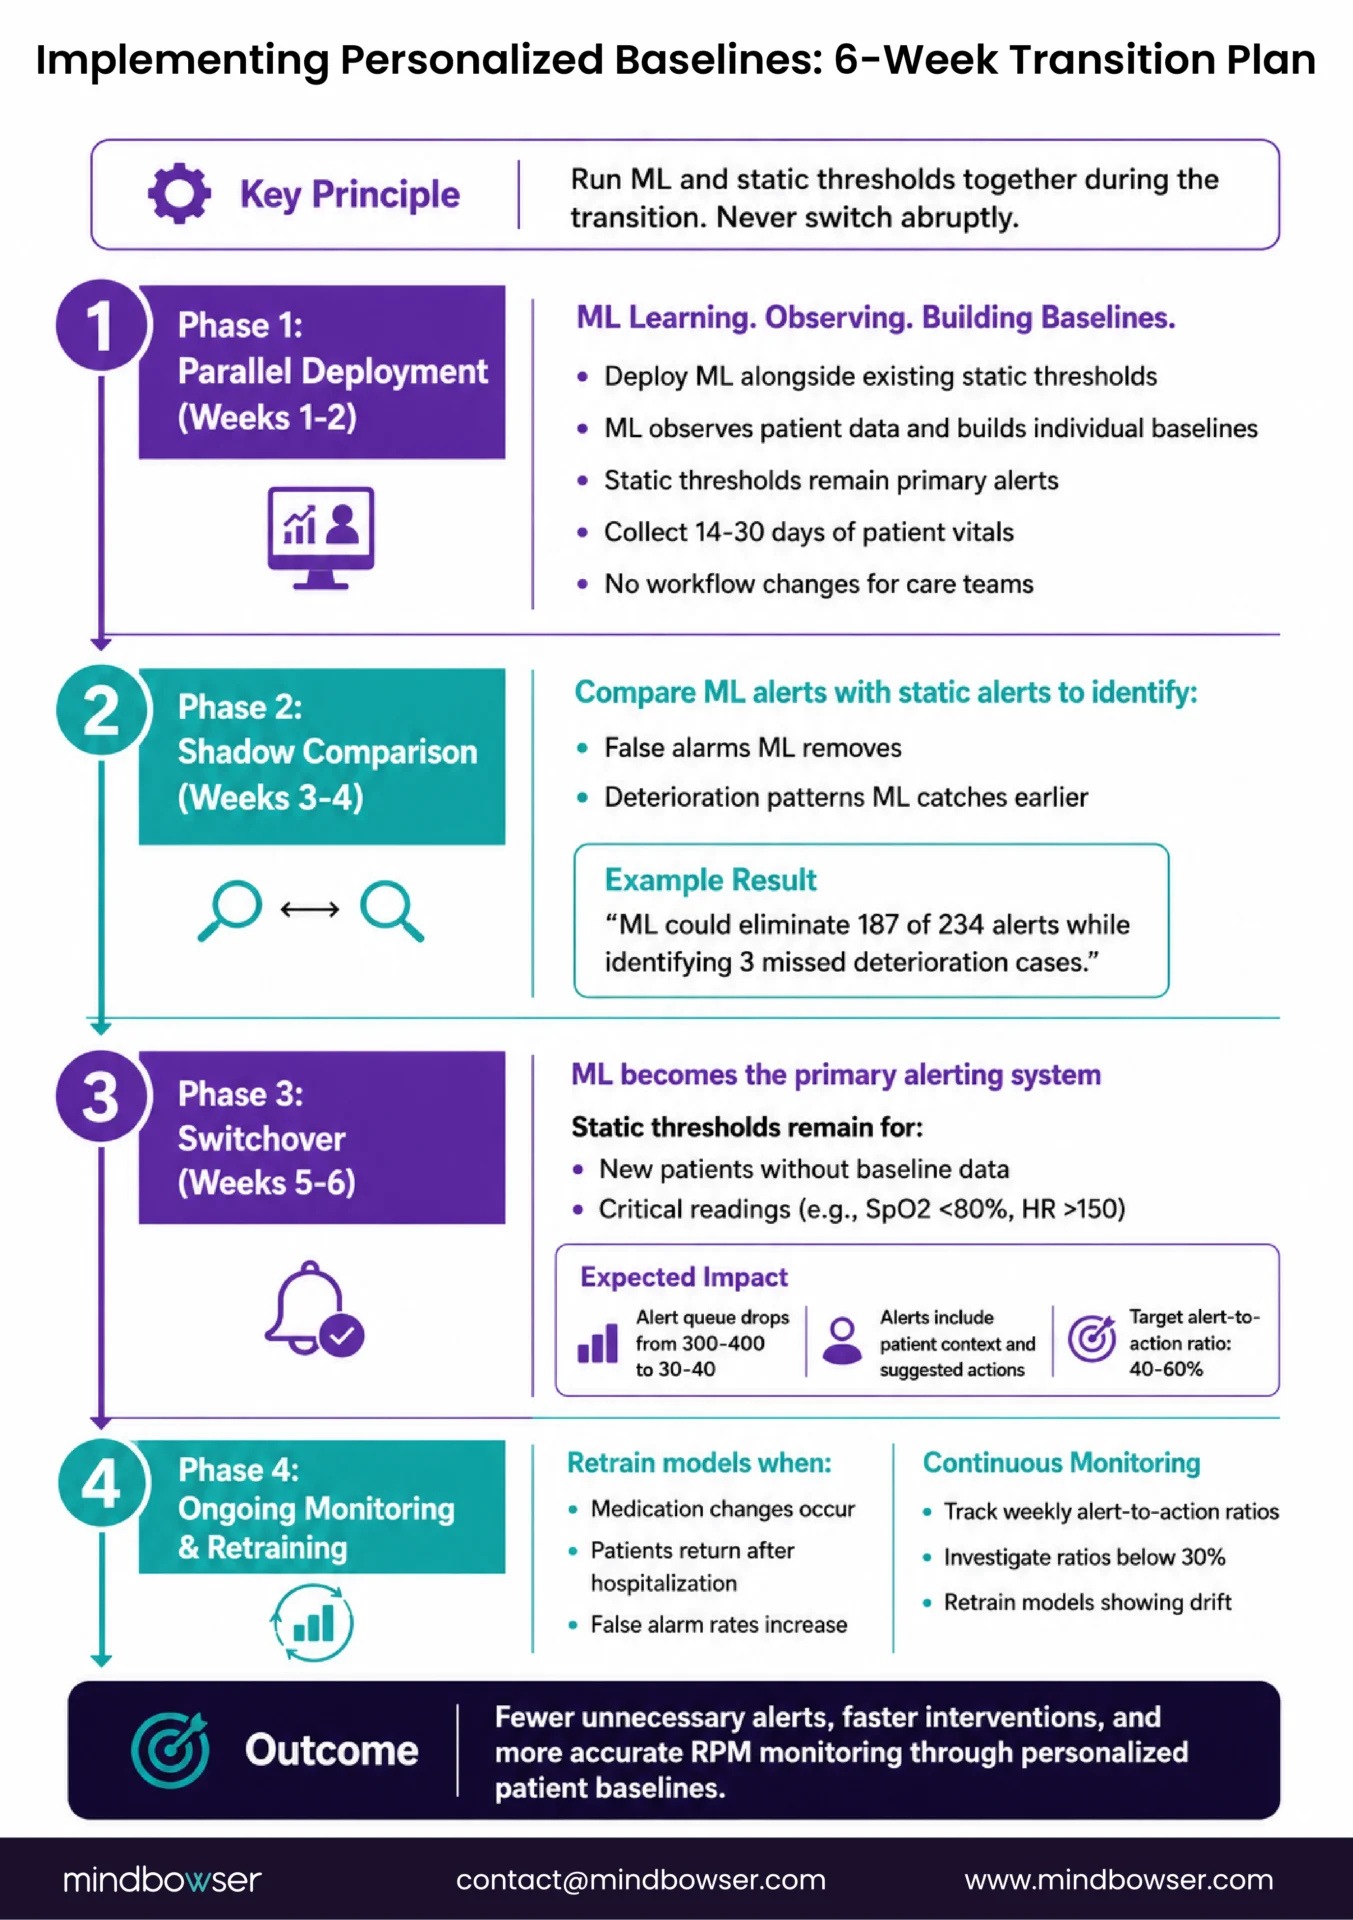
Four phases over 6-8 weeks. The key principle: run ML and static thresholds in parallel during the transition. Never switch cold.
Phase 1: Parallel deployment (weeks 1-2).
Deploy the ML baseline system alongside existing static thresholds. Both systems run simultaneously. Static thresholds remain the primary alerting mechanism. The ML system observes patient data and begins building individual baselines. No ML-generated alerts reach the care team yet.
During this phase, collect the baseline data the ML needs: 14-30 days of per-patient vital sign readings. The system is learning. The care team sees no change in their workflow.
Phase 2: Shadow comparison (weeks 3-4).
ML baselines are now established for patients enrolled during Phase 1. Run a shadow comparison: for every static alert that fired, did the ML system also flag it? For every ML alert, did a static alert fire? The divergence analysis reveals: false alarms the ML eliminates (static fired, ML did not flag because the reading was within the patient’s personal range) and true positives the ML catches that static missed (patient declining within their “normal” range, never crossing the population threshold).
This shadow data builds the evidence case for the care team: “ML would have eliminated 187 of the 234 alerts you processed last week while catching 3 deterioration patterns that static thresholds missed.”
Phase 3: Switchover (weeks 5-6).
Switch primary alerting from static to ML-based for patients with established baselines. Keep static thresholds as a safety fallback for: newly enrolled patients without 14 days of baseline data, critical absolute values that should always alert regardless of baseline (SpO2 below 80%, SBP above 200, heart rate above 150).
The care team now works from the ML-prioritized alert queue. The queue is smaller (30-40 items vs 300-400). Each alert includes patient context and suggested action. Monitor the alert-to-action ratio: target 40-60% of ML alerts generating clinical action.
Phase 4: Ongoing monitoring and retraining.
Patient conditions change. A new medication alters the BP baseline. A hospitalization disrupts the activity pattern. Seasonal changes affect weight and respiratory function. The ML models need periodic retraining.
Trigger retraining when: care manager flags a medication change (widen the acceptable range for 7-14 days while the new baseline establishes), patient is hospitalized and returns to RPM (reset the baseline with fresh 14-day observation), or the false alarm rate for a patient increases unexpectedly (the model may be stale).
Weekly monitoring of the alert-to-action ratio across the patient panel catches model drift before it becomes a clinical problem. If the ratio drops below 30%, investigate which patients are generating excessive ML alerts and retrain their models.
Where Is This Heading? Digital Twins and Predictive RPM
The current state of personalized baselines is reactive but fast: the system detects anomalies relative to the patient’s history and alerts the care team. The deterioration has started. The detection happens earlier than static thresholds catch it, but it is still a detection, not a prediction.
The next state is predictive baselines: models that forecast deterioration before anomalies become visible in the vital sign data. Sandra Elliott of Hackensack Meridian Health, presenting at that same BRI Network 2026 summit, demonstrated 24-48 hour prediction windows for clinical deterioration using AI trained on individual patient baselines. The model does not wait for SpO2 to drop. It detects the pre-cursor pattern (subtle changes in heart rate variability, activity patterns, and respiratory rate that precede the SpO2 decline by 24-48 hours) and alerts before the deterioration becomes measurable in the primary vital sign.
The further-out direction is the Digital Twin: a computational model of each patient’s physiology that can simulate responses to conditions, medications, activities, and treatments. “If we increase this patient’s diuretic dose, what does the model predict their weight and BP trajectory will look like over the next 72 hours?” That is simulation, not just monitoring. Biofourmis is investing in this direction. Academic labs are publishing. The data density from CGMs (288 readings/day), continuous pulse oximeters, and multi-device wearable stacks makes the input data feasible.
Realistic timeline:
- Personalized baselines (anomaly detection): production-ready today. This is what RPMCheck AI and Biofourmis Biovitals deliver
- Predictive baselines (24-48hr forecasting): early production 2025-2027. Elliott’s Hackensack Meridian Health data proves the clinical concept. Scaling across patient populations is the current engineering challenge
- Digital Twins (patient physiology simulation): research to early clinical 2028-2030+. The computational models exist in labs. Clinical validation at scale is years away
For RPM programs launching today, personalized baselines (Layer 1-3 in our architecture) are the immediate upgrade from static thresholds. Predictive capabilities will layer on top as the models mature. The platform architecture should be designed to accommodate predictive layers without rebuilding the baseline infrastructure.
The Question the Algorithm Asks Is the Question That Matters
Static thresholds ask: “Is this reading abnormal?” That question is answerable with a single comparison. It is also clinically crude. A reading of 90% SpO2 is flagged identically for a patient whose baseline is 96% and a patient whose baseline is 89%. The question cannot distinguish between emergency and normalcy because it has no concept of “normal for this patient.”
Personalized baselines ask: “Is this reading abnormal for this patient?” That question requires knowing the patient’s history, their typical range, their recent trajectory, their diurnal patterns, and ideally the context of recent medication or activity changes. The question is computationally harder. It is also the only question that produces clinically useful alerts at scale.
The programs that deploy personalized baselines report 60-80% false alarm reduction while catching more true deterioration events. Not fewer true positives. More. Because composite scoring across multiple vitals detects multi-system deterioration patterns that single-vital static thresholds miss entirely. The care team sees fewer total alerts AND catches more real problems. That is not a trade-off. It is the result of asking a better question.
Two years ago I would have said personalized baselines require deep ML expertise and months of development. The tooling has matured. Statistical process control on patient-specific rolling means, which is basic statistics, not deep learning, captures 70% of the value. The remaining 30% comes from composite scoring and time-series models. Start with SPC. Add LSTM when SPC is not enough. The first layer deploys in days. The sophistication grows with the program.
If your RPM program is running on static thresholds and you are seeing the 80%+ false alarm rate that every static-threshold program eventually hits, the fix is architectural. Not algorithmic. Not about finding the right threshold number. About asking the right question of the data. Reach out.
Personalized baselines are ML models that learn what is physiologically normal for each individual RPM patient over 14-30 days of data collection. Instead of comparing vital sign readings to a fixed population threshold (e.g., SpO2 below 90% for everyone), the system compares each reading to that patient’s own historical range and flags deviations from their personal pattern. A reading of 90% SpO2 triggers an alert for a patient with a baseline of 95% but is flagged as normal for a patient with a baseline of 89%.
Fourteen to thirty days of continuous vital sign data from the patient’s RPM devices. During this learning period, static thresholds remain active as a safety net. After the baseline is established, the system switches to personalized anomaly detection. For patients starting a new medication or returning from a hospitalization, the baseline should be re-established over 7-14 days with temporarily widened thresholds during the transition.
Static thresholds compare every patient’s reading to the same population-level number (e.g., SpO2 below 90% = alert). This produces 80-90% false alarm rates because patient baselines vary widely. ML-based anomaly detection learns each patient’s personal baseline and flags deviations from their individual normal. The result: 60-80% fewer false alarms while maintaining or improving true positive detection. Static thresholds ask “Is this reading abnormal?” ML baselines ask “Is this reading abnormal for this patient?”
It depends on the function. If the AI operates as a standalone medical device that diagnoses conditions or provides therapeutic recommendations, FDA clearance is required (Biofourmis Biovitals has this clearance). If the AI functions as clinical decision support (CDS) within a broader platform, providing information to clinicians who make the final clinical decision, FDA clearance is not required under current CDS guidance. Most custom RPM platforms with AI triage layers fall into the CDS category. Consult regulatory counsel for your specific implementation.
Biofourmis Biovitals (the FDA-cleared benchmark) achieves 93% deterioration prediction accuracy with 21-hour average advance warning, compared to 64% for NEWS2 standard clinical scoring. The Sentinel AI agent (arxiv, 2026) achieved 95.8% emergency sensitivity and 88.5% sensitivity for all actionable alerts. RPMCheck AI achieves 60-80% false alarm reduction while maintaining or improving true positive catch rates across deployments.
Yes. Personalized baselines deploy as a modular layer on top of existing RPM platforms. The implementation takes 6-8 weeks: 2 weeks parallel deployment (ML learning alongside static thresholds), 2 weeks shadow comparison (measuring ML vs static performance), 2 weeks switchover (ML becomes primary alerting), then ongoing monitoring. The ML system ingests the same vital sign data the existing platform already collects. No new devices or data sources are required. The output (risk-scored, explainable alerts) feeds into the existing care team dashboard.