Data visualization as a service (DVaaS) is a cloud-based solution that turns your data into easy-to-understand pictures. Instead of staring at endless rows of numbers, you see clear charts, graphs, and maps that tell a story. This makes it simple to spot trends, patterns, and opportunities hidden in your data.

Data visualization as a service (DVaaS) is a cloud-based solution that turns your data into easy-to-understand pictures. Instead of staring at endless rows of numbers, you see clear charts, graphs, and maps that tell a story. This makes it simple to spot trends, patterns, and opportunities hidden in your data.
We offer a range of data visualization as a service solutions to fit your specific needs:

Create dynamic dashboards that show key performance indicators (KPIs) and other important metrics. You can easily filter and drill down to uncover insights.

We design unique visualizations customized to your business needs. This could be anything from complex statistical charts to interactive maps.

See what the future might hold with visualizations that use predictive models. This helps you plan ahead and make informed decisions.

Map your data to understand spatial relationships and patterns. This is useful for businesses in logistics, real estate, and more.

Integrate data visualizations directly into your existing applications. This gives users insights without leaving their workflow.

Create compelling narratives with data visualizations. This helps you communicate your findings effectively to stakeholders.
Using data visualization as a service can bring many benefits to your business:
Our data visualization as a service process involves several steps:
We gather your data from different sources and clean it up to ensure accuracy.
We explore your data to understand its structure and identify potential insights.
We create custom visualizations that effectively communicate your data story.
We deploy the visualizations on a platform that is easy to use and access.
We continuously monitor the performance of your visualizations and make improvements as needed.

Our team has deep knowledge of data analysis and visualization techniques.

We create tailored solutions that meet your specific needs.

We have a history of successful data visualization as a service projects.

We provide excellent support throughout the entire process.

Our solutions can grow with your business.

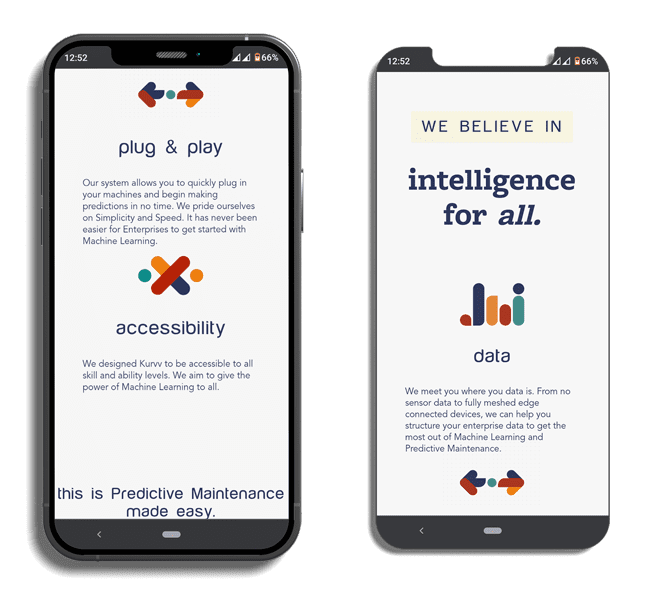
The customer is a machine learning service provider that allows non-technical business professionals to select, train, and apply machine learning to their business. Based in Bellevue, Washington, the company was looking for a reliable partner who could deliver an end-to-end data analytics solution for them.

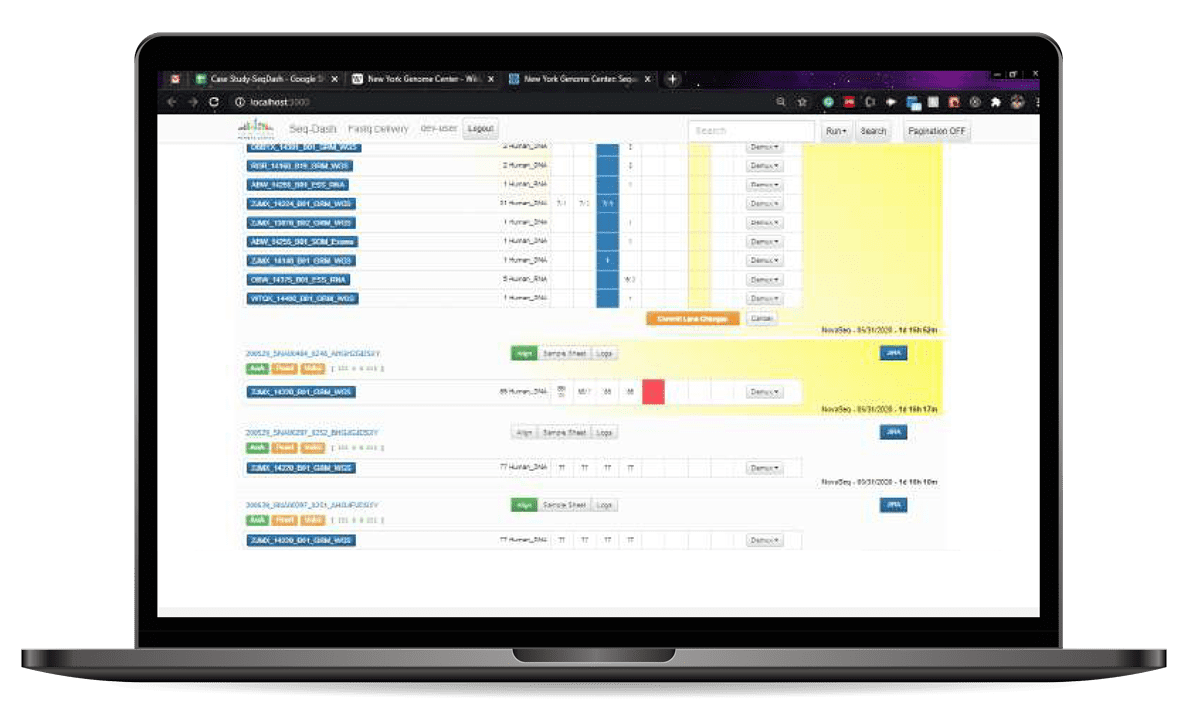
The platform is part of the work done by Mindbowser for The New York Genome Center (NYGC). NYGC is an independent nonprofit academic research institution in New York. The client approached Mindbowser to convert the old application into a new stack. The old application had quality and performance issues. We differentiated all tasks in Jira stories and created sprints to boost the development speed and give proper and on-time delivery.

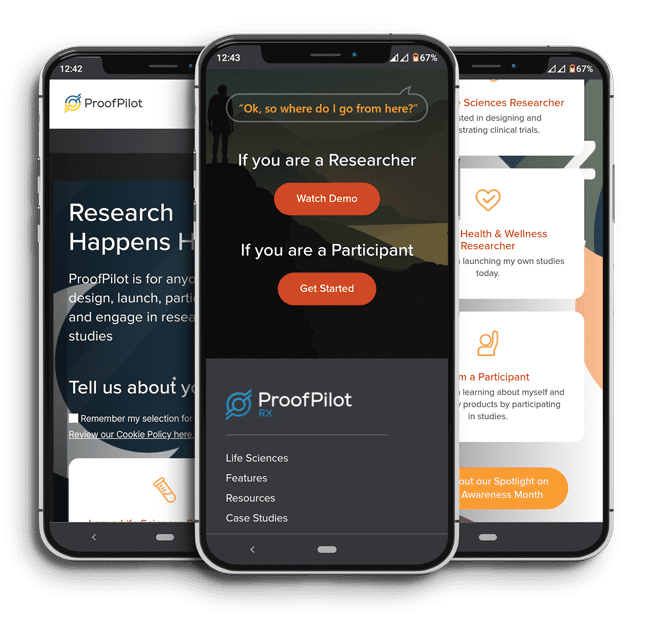
ProofPilot is a healthcare tech platform that allows individuals to
design, manage, launch, and participate in research studies. ProofPilot keeps the data on the platform secure while providing tools to the user to conduct their research studies.
ProofPilot has raised 2Mn in Venture Capital to date

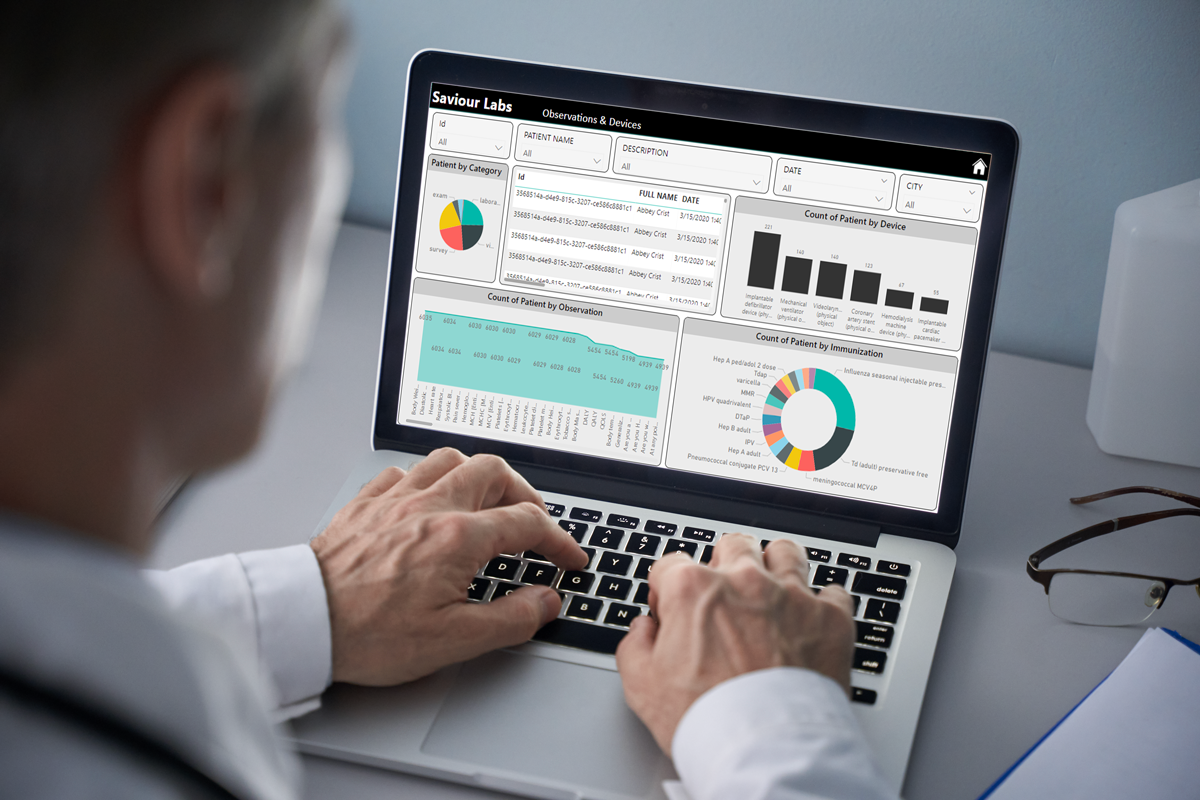
Our high-quality equipment enhances diagnostics and patient care, aiming to revolutionize the industry. The platform delivers devices with user-friendly dashboards, streamlining management for hospitals and providers.


Delivering the best solutions starts with understanding the business needs. Our approach is tailored to meet your unique goals and objectives.
Our product development cycle involves various stages, including design, development, testing and launch. Our iterative process ensures that all builds meet requirements and enhance user experience. We monitor the performance and identify improvement areas.
Learn MoreBacked with Design Sprint practice, we help our customers evolve their products and plans. A Design Sprint is a series of meticulously designed steps, conceptualized by Google to build better user experience and design thinking into the products.
Learn MoreMindbowser’s scrum framework is designed to help you deliver your sprints faster and with more continuous empowerment. With Agile approach you become flexible and responsive to changing needs and priorities, delivering high-quality services quickly and efficiently.
Learn MoreWe emphasize iterative processes to develop and release products or services rapidly. We rely on data-driven insights and metrics to ensure informed decisions are validated. With such an approach you can achieve high-quality and reliable outcomes.
Learn MoreWe use the best DevOps practices to ensure proper project environments. This includes daily commits and performance dashboards to bring predictability. The team commits code every day so that daily progress can be tracked.
Learn MoreWith rapid prototyping, our team creates low-fidelity and interactive prototypes that can be shared with users and stakeholders for feedback. We identify and address potential problems or issues early in the development process, reducing the risk of costly mistakes.
Learn MoreWe prioritize clean code to create more maintainable software with fewer bugs and errors. Our experienced developers are skilled in writing clean, efficient, and well-structured code, ensuring that our products are reliable, scalable and of the highest quality.
Learn MoreOur approach to Smart QA is nothing but a combination of human expertise and AI capabilities, revolutionizing software delivery. The innovative QA approach improves the efficiency of our testing practices and ensures the delivery of high-quality software that meets the evolving needs of the industry.
Learn MoreWe prioritize zero-trust security as a key element of our approach to information security. Our experienced team of security experts leverages cutting-edge tools and technologies to implement a robust zero-trust architecture that protects the data and assets.
Learn MoreOur launch and support services are designed to help our clients achieve their goals after launch and over the long term. We provide ongoing support and maintenance, including bug fixes, feature updates, and security, to ensure the products and services run well.
Learn MoreThe cost of data Visualization as a service depends on several factors, including the complexity of your project, the size of your data, and the specific services you need. We offer flexible pricing options to meet your budget.
The implementation timeline varies depending on the project scope. However, we work efficiently to deliver results as quickly as possible.
You can visualize almost any type of data with data visualization as a service, including numerical, categorical, and geographical data.

We worked with Mindbowser on a design sprint, and their team did an awesome job. They really helped us shape the look and feel of our web app and gave us a clean, thoughtful design that our build team could...


The team at Mindbowser was highly professional, patient, and collaborative throughout our engagement. They struck the right balance between offering guidance and taking direction, which made the development process smooth. Although our project wasn’t related to healthcare, we clearly benefited...

Founder, Texas Ranch Security

Mindbowser played a crucial role in helping us bring everything together into a unified, cohesive product. Their commitment to industry-standard coding practices made an enormous difference, allowing developers to seamlessly transition in and out of the project without any confusion....

CEO, MarketsAI

I'm thrilled to be partnering with Mindbowser on our journey with TravelRite. The collaboration has been exceptional, and I’m truly grateful for the dedication and expertise the team has brought to the development process. Their commitment to our mission is...

Founder & CEO, TravelRite

The Mindbowser team's professionalism consistently impressed me. Their commitment to quality shone through in every aspect of the project. They truly went the extra mile, ensuring they understood our needs perfectly and were always willing to invest the time to...

CTO, New Day Therapeutics

I collaborated with Mindbowser for several years on a complex SaaS platform project. They took over a partially completed project and successfully transformed it into a fully functional and robust platform. Throughout the entire process, the quality of their work...

President, E.B. Carlson

Mindbowser and team are professional, talented and very responsive. They got us through a challenging situation with our IOT product successfully. They will be our go to dev team going forward.

Founder, Cascada

Amazing team to work with. Very responsive and very skilled in both front and backend engineering. Looking forward to our next project together.

Co-Founder, Emerge

The team is great to work with. Very professional, on task, and efficient.

Founder, PeriopMD

I can not express enough how pleased we are with the whole team. From the first call and meeting, they took our vision and ran with it. Communication was easy and everyone was flexible to our schedule. I’m excited to...

Founder, Seeke

We had very close go live timeline and Mindbowser team got us live a month before.

CEO, BuyNow WorldWide

Mindbowser brought in a team of skilled developers who were easy to work with and deeply committed to the project. If you're looking for reliable, high-quality development support, I’d absolutely recommend them.

Founder, Teach Reach

Mindbowser built both iOS and Android apps for Mindworks, that have stood the test of time. 5 years later they still function quite beautifully. Their team always met their objectives and I'm very happy with the end result. Thank you!

Founder, Mindworks

Mindbowser has delivered a much better quality product than our previous tech vendors. Our product is stable and passed Well Architected Framework Review from AWS.

CEO, PurpleAnt

I am happy to share that we got USD 10k in cloud credits courtesy of our friends at Mindbowser. Thank you Pravin and Ayush, this means a lot to us.

CTO, Shortlist

Mindbowser is one of the reasons that our app is successful. These guys have been a great team.

Founder & CEO, MangoMirror

Kudos for all your hard work and diligence on the Telehealth platform project. You made it possible.

CEO, ThriveHealth

Mindbowser helped us build an awesome iOS app to bring balance to people’s lives.

CEO, SMILINGMIND

They were a very responsive team! Extremely easy to communicate and work with!

Founder & CEO, TotTech

We’ve had very little-to-no hiccups at all—it’s been a really pleasurable experience.

Co-Founder, TEAM8s

Mindbowser was very helpful with explaining the development process and started quickly on the project.

Executive Director of Product Development, Innovation Lab

The greatest benefit we got from Mindbowser is the expertise. Their team has developed apps in all different industries with all types of social proofs.

Co-Founder, Vesica

Mindbowser is professional, efficient and thorough.

Consultant, XPRIZE

Very committed, they create beautiful apps and are very benevolent. They have brilliant Ideas.

Founder, S.T.A.R.S of Wellness

Mindbowser was great; they listened to us a lot and helped us hone in on the actual idea of the app. They had put together fantastic wireframes for us.

Co-Founder, Flat Earth

Mindbowser was incredibly responsive and understood exactly what I needed. They matched me with the perfect team member who not only grasped my vision but executed it flawlessly. The entire experience felt collaborative, efficient, and truly aligned with my goals.

Founder, Child Life On Call

The team from Mindbowser stayed on task, asked the right questions, and completed the required tasks in a timely fashion! Strong work team!

CEO, SDOH2Health LLC

Mindbowser was easy to work with and hit the ground running, immediately feeling like part of our team.

CEO, Stealth Startup

Mindbowser was an excellent partner in developing my fitness app. They were patient, attentive, & understood my business needs. The end product exceeded my expectations. Thrilled to share it globally.

Owner, Phalanx

Mindbowser's expertise in tech, process & mobile development made them our choice for our app. The team was dedicated to the process & delivered high-quality features on time. They also gave valuable industry advice. Highly recommend them for app development...

Co-Founder, Fox&Fork
