


In 2024, there are some new and exciting data visualization tools that are worth checking out. These tools can help you see patterns, trends, and outliers in your data. They can also help you communicate your findings to others in a clear and concise way.
According to a research, data visualization tools Market size is projected to reach $10.2 billion by 2026, at a CAGR of 11.6% during the forecast period, 2021-2026.
If you’re looking for a way to improve your data analysis and communication, data visualization tools are a great option. There are many different tools available, so you can find one that’s right for your needs.
Top 10 Data Visualization Tools to Help You Handle Your Data
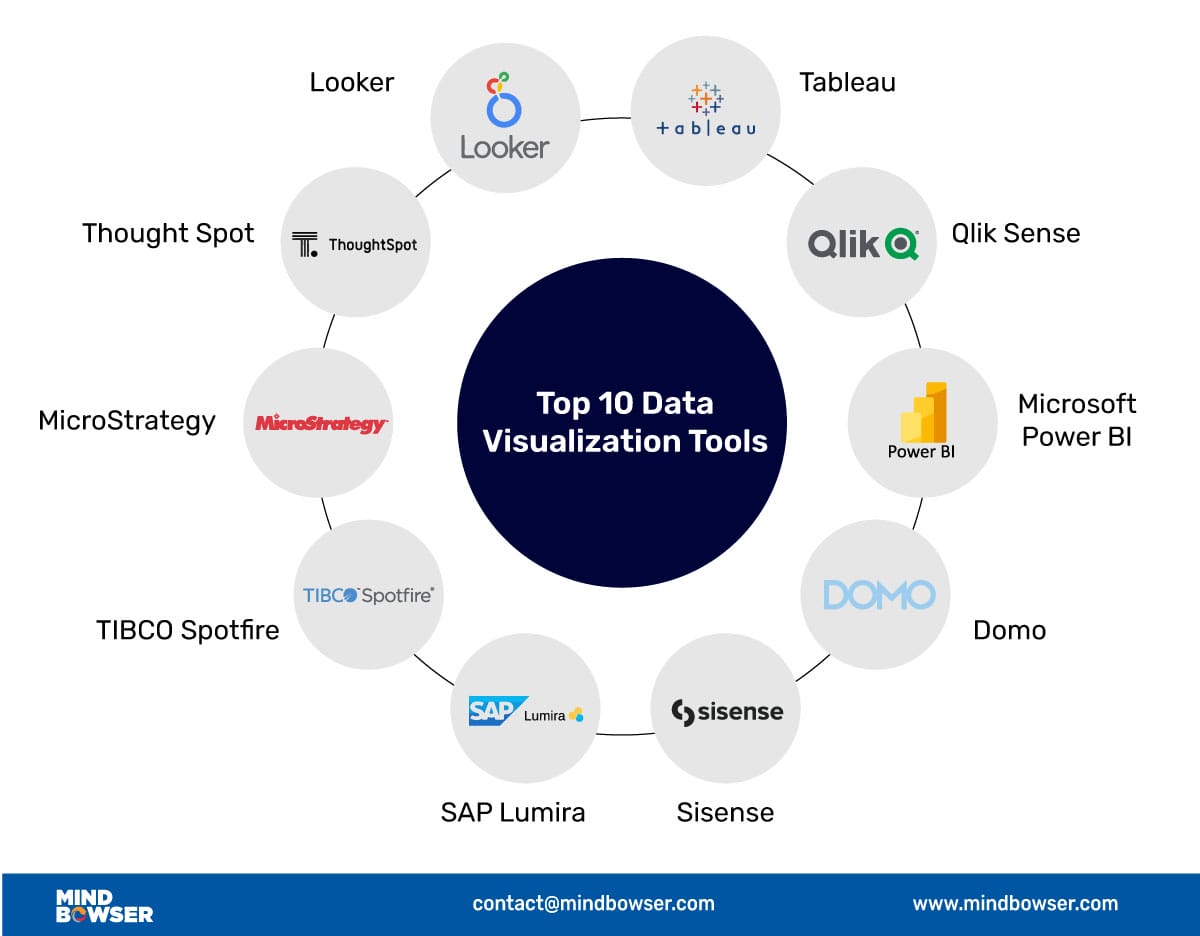
Let’s now take a look at visual discovery with these 10 powerful data visualization tools that not only make data approachable but transform it into your key to business insights.
1. Tableau
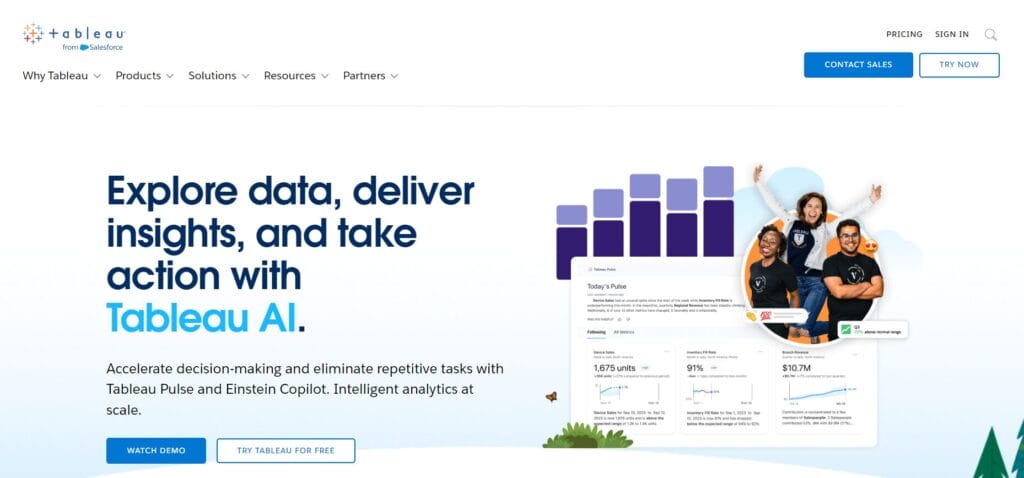
Tableau is a great data visualization software among the best interactive data visualization tools. It helps in making big data small and small data meaningful, understandable, and actionable.
This makes it easy to acquire insights from dashboards and worksheets as it enables the development and design of interactive maps, graphs, charts, and so on, which are then updated in the dashboard for the users to see and make sense of the data.
It offers easy drag-and-drop features and helps users to see the data in real time. Data sharing is also easy with the help of Tableau servers and can be shared on the web.
2. Qlik Sense
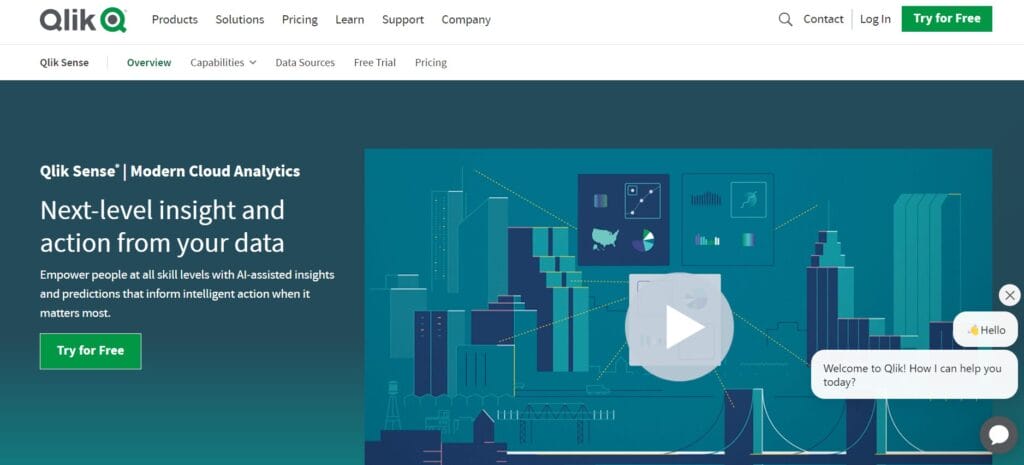
Qlik Sense is a complete data analytics solution that helps tackle even the most complex data analytics problems. It is a well-known data visualization software that is widely used and offers a lot of features and flexibility to its users and also allows them to link data from various sources for better analytics.
It also has an easy-to-use interface and comes close to Tableau when compared with each other.
All in all, it’s one of the best data visualization tools out there.
3. Microsoft Power BI
Power BI’s primary focus is business intelligence. The tool gives users the ability to access on-premises and in-cloud data. The free tier offers up to 1GB of data usage, and the users can make reports and share them on the dashboards.
The paid version has added features that let users fully interact with the data and share queries via the data catalog.
4. Domo
Domo is considered one of the best options for companies looking for independent and self-service visualization and analytics solutions out of all the data visualization tools available. It is easy to use and can also be viewed on mobile devices, making it a go-to choice for companies who collaborate and communicate with their shareholders and want to provide all the necessary information and updates.
It also includes popular data sources like Amazon Web Services (AWS), Google Analytics, and more.
5. Sisense
Sisense is a powerful visual report generator that offers users an easy-to-use interface. This is one of the data visualization tools that also allows users to collect and analyze high-volume data and generate smart analytics reports. It also enables data collection from multiple sources and stores them in a single source, making it easy to analyze and make sense of the available data.
Sisense is used by some prominent organizations like NASA, Merck, eBay, ESPN, and SONY.
6. SAP Lumira
Formerly known as Visual Intelligence, SAP Lumira is one of the better self-service data visualization tools that enables business users to create and visualize stories on datasets.
One of the main features of SAP Lumira is that it enables users to connect to multiple data sources, both online and offline, and is available for individuals, small businesses, and big enterprises.
7. TIBCO Spotfire
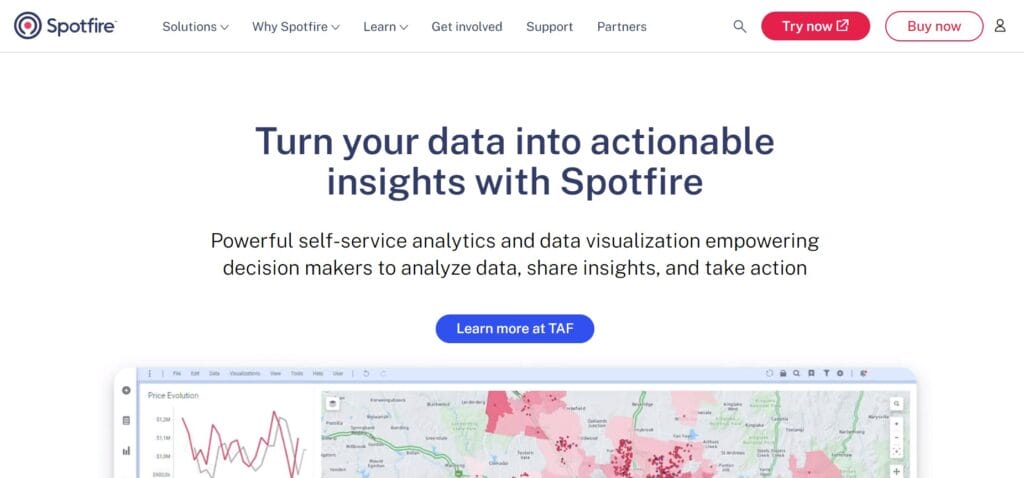
TIBCO Spotfire is a smart enterprise-class data visualization platform that offers an AI-based engine that helps reduce friction in the discovery of data.
It allows the user to understand and make sense of the data quickly and can be used on desktop, cloud, and platform editions. It is used by some top organizations like Procter and Gamble, Cisco, NetApp, and Shell.
8. MicroStrategy
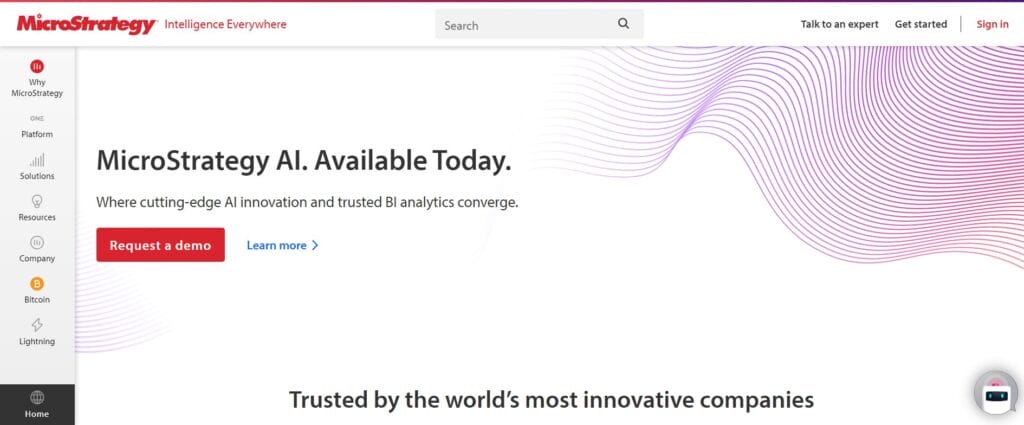
One of the great features of MicroStrategy is that it not only supports data visualization but also supports data mining. It offers many other features like interactive dashboards, highly formatted reports, scorecards, and automated report distribution.
It is great for individual users and offers a user-friendly interface, quick downloads, and installations. It can also be connected with cloud-based data sources and personal spreadsheets and support mobile and web apps.
9. ThoughtSpot
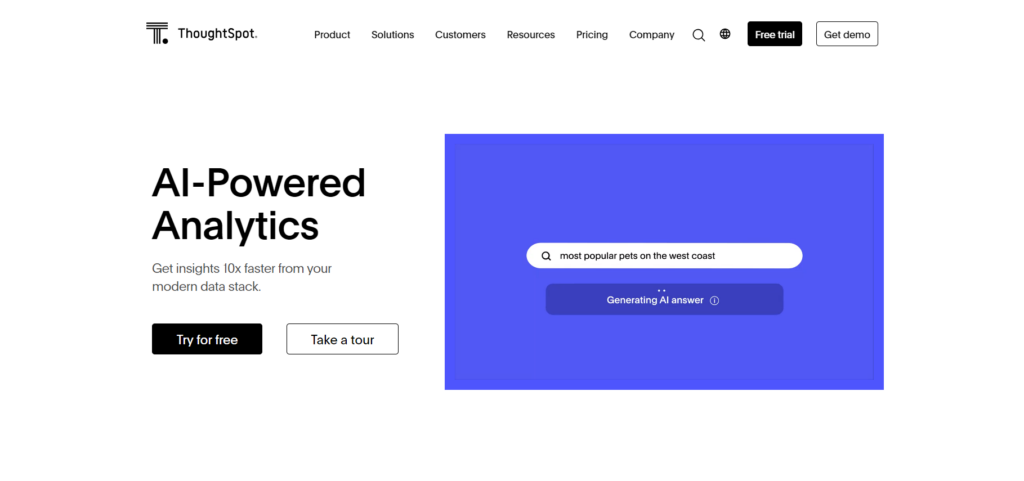
ThoughtSpot is one of the data visualization tools that has AI-driven analytics that anyone can use to do data-oriented searches and helps get quick and reliable insights.
It is more like a search engine than a data visualization tool and allows users to do guided searches throughout the company data.
ThoughSpot is often used by financial service professionals who need quick insights to make data-oriented decisions.
10. Looker
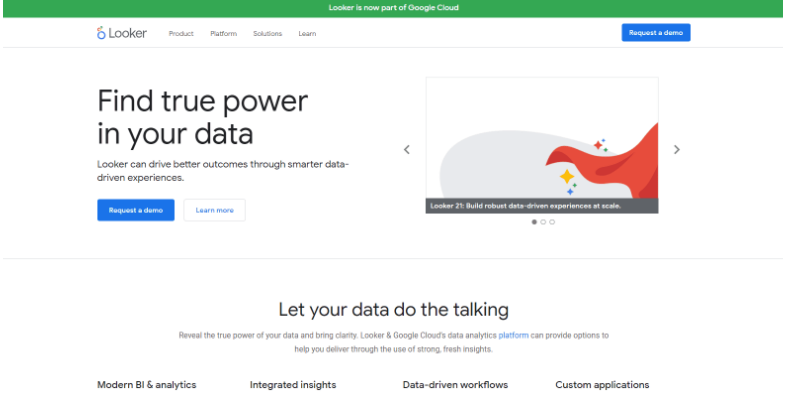
Looker by Google is some of the best browser-based data visualization tools that offers a user-friendly environment and dashboard collaboration. It also allows users to easily create custom visualizations and share reports and analytics. It is also used by leading companies like Amazon, The Economist, IBM, Spotify, etc.

Choose the Right Data Visualization Tool
Whether you’re dealing with big data or just need quick insights, these tools have you covered. Each of the data visualization tools we’ve covered has unique strengths, from Tableau’s interactive features to ThoughtSpot’s AI-driven searches. Choosing the right one is crucial for gaining a competitive edge in data-driven decision-making.
Mindbowser is a leading provider of data visualization services. We can help you learn how to use data visualization tools to get the most out of your data. We also offer a variety of data visualization solutions that can help you create stunning visualizations that will tell your data story.
Contact us today to learn more about how we can help you with your data visualization needs.
Frequently Asked Questions
Data visualization tools are software programs designed to transform data into clear, concise visual representations. These tools aid in effective communication and comprehension of complex information through charts, graphs, and other visual elements.
Some of the best data visualization tools available are: –
- Tableau
- Microsoft Power BI
- Looker
- Qlik Sense
- Sisense
Features you should look for in data visualization tools are: –
Prioritize features like seamless data connectivity and diverse chart options to ensure compatibility with your data and desired representations. Customization control empowers clear communication, while interactivity fosters deeper user engagement.
Modern data visualization tools are no longer confined to static snapshots. Many now excel at handling real-time data, offering live streaming, dynamic dashboards, and time-based visualizations that update as your data ebbs and flows.
Data security is a crucial aspect of data visualization tools, and different tools employ various methods to safeguard your information.
Here are some of the data security measures: –
- Encryption
- Access control
- Authentication
- Auditing and logging
- Compliance and regulations
Yes, Power BI is a data visualization tool, and in fact, it’s considered one of the most popular and robust data visualization tools available. Here is why: –
- Extensive visualization capabilities
- Self-service platform
- Data connectivity
- Interactivity and sharing