BLOGS
BLOGS  NEWSROOM
  CASE STUDIES
  WEBINARS
  PODCASTS
  ASSET HUB
  EVENT CALENDAR


TL;DR
Patient attribution determines who you’re financially responsible for in value-based care. Most ACOs still rely on volatile, multi-payer lists that shift monthly, distort shared-savings calculations, and disrupt population health operations. The fix is a unified attribution “data product” that normalizes payer files, locks panels early, and feeds real-time dashboards for clinical teams. With the right architecture, attribution becomes predictable, auditable, and directly tied to quality and financial performance.
If your ACO board asked tomorrow, “Exactly which patients are we accountable for right now?” could you answer with confidence?
Most organizations cannot. Attribution is the quiet denominator behind every shared-savings, Stars, and quality conversation, yet very few ACOs treat it as a governed, engineering-grade function. Instead, payer files arrive in mixed formats, PCP visit logic changes between contracts, and panels shift enough to distort performance reporting.
We show why attribution problems persist, how a lock strategy stabilizes your population by Q2, and what a modern attribution dashboard looks like when it’s built on the right data fabric.
We also highlight how integrated accelerators like HealthConnect CoPilot, AI Medical Summary, and AI Readmission Risk eliminate manual reconciliation and expose the real financial drivers hidden in your panels.
I. Denominator Myths: Why Your “5,000 Patients” Are Not Really 5,000
Most ACO executives walk into budgeting season quoting a clean, round attribution number. But in reality, the “5,000” on paper rarely matches the true accountable population. Three hidden forces distort the denominator long before performance reporting begins.
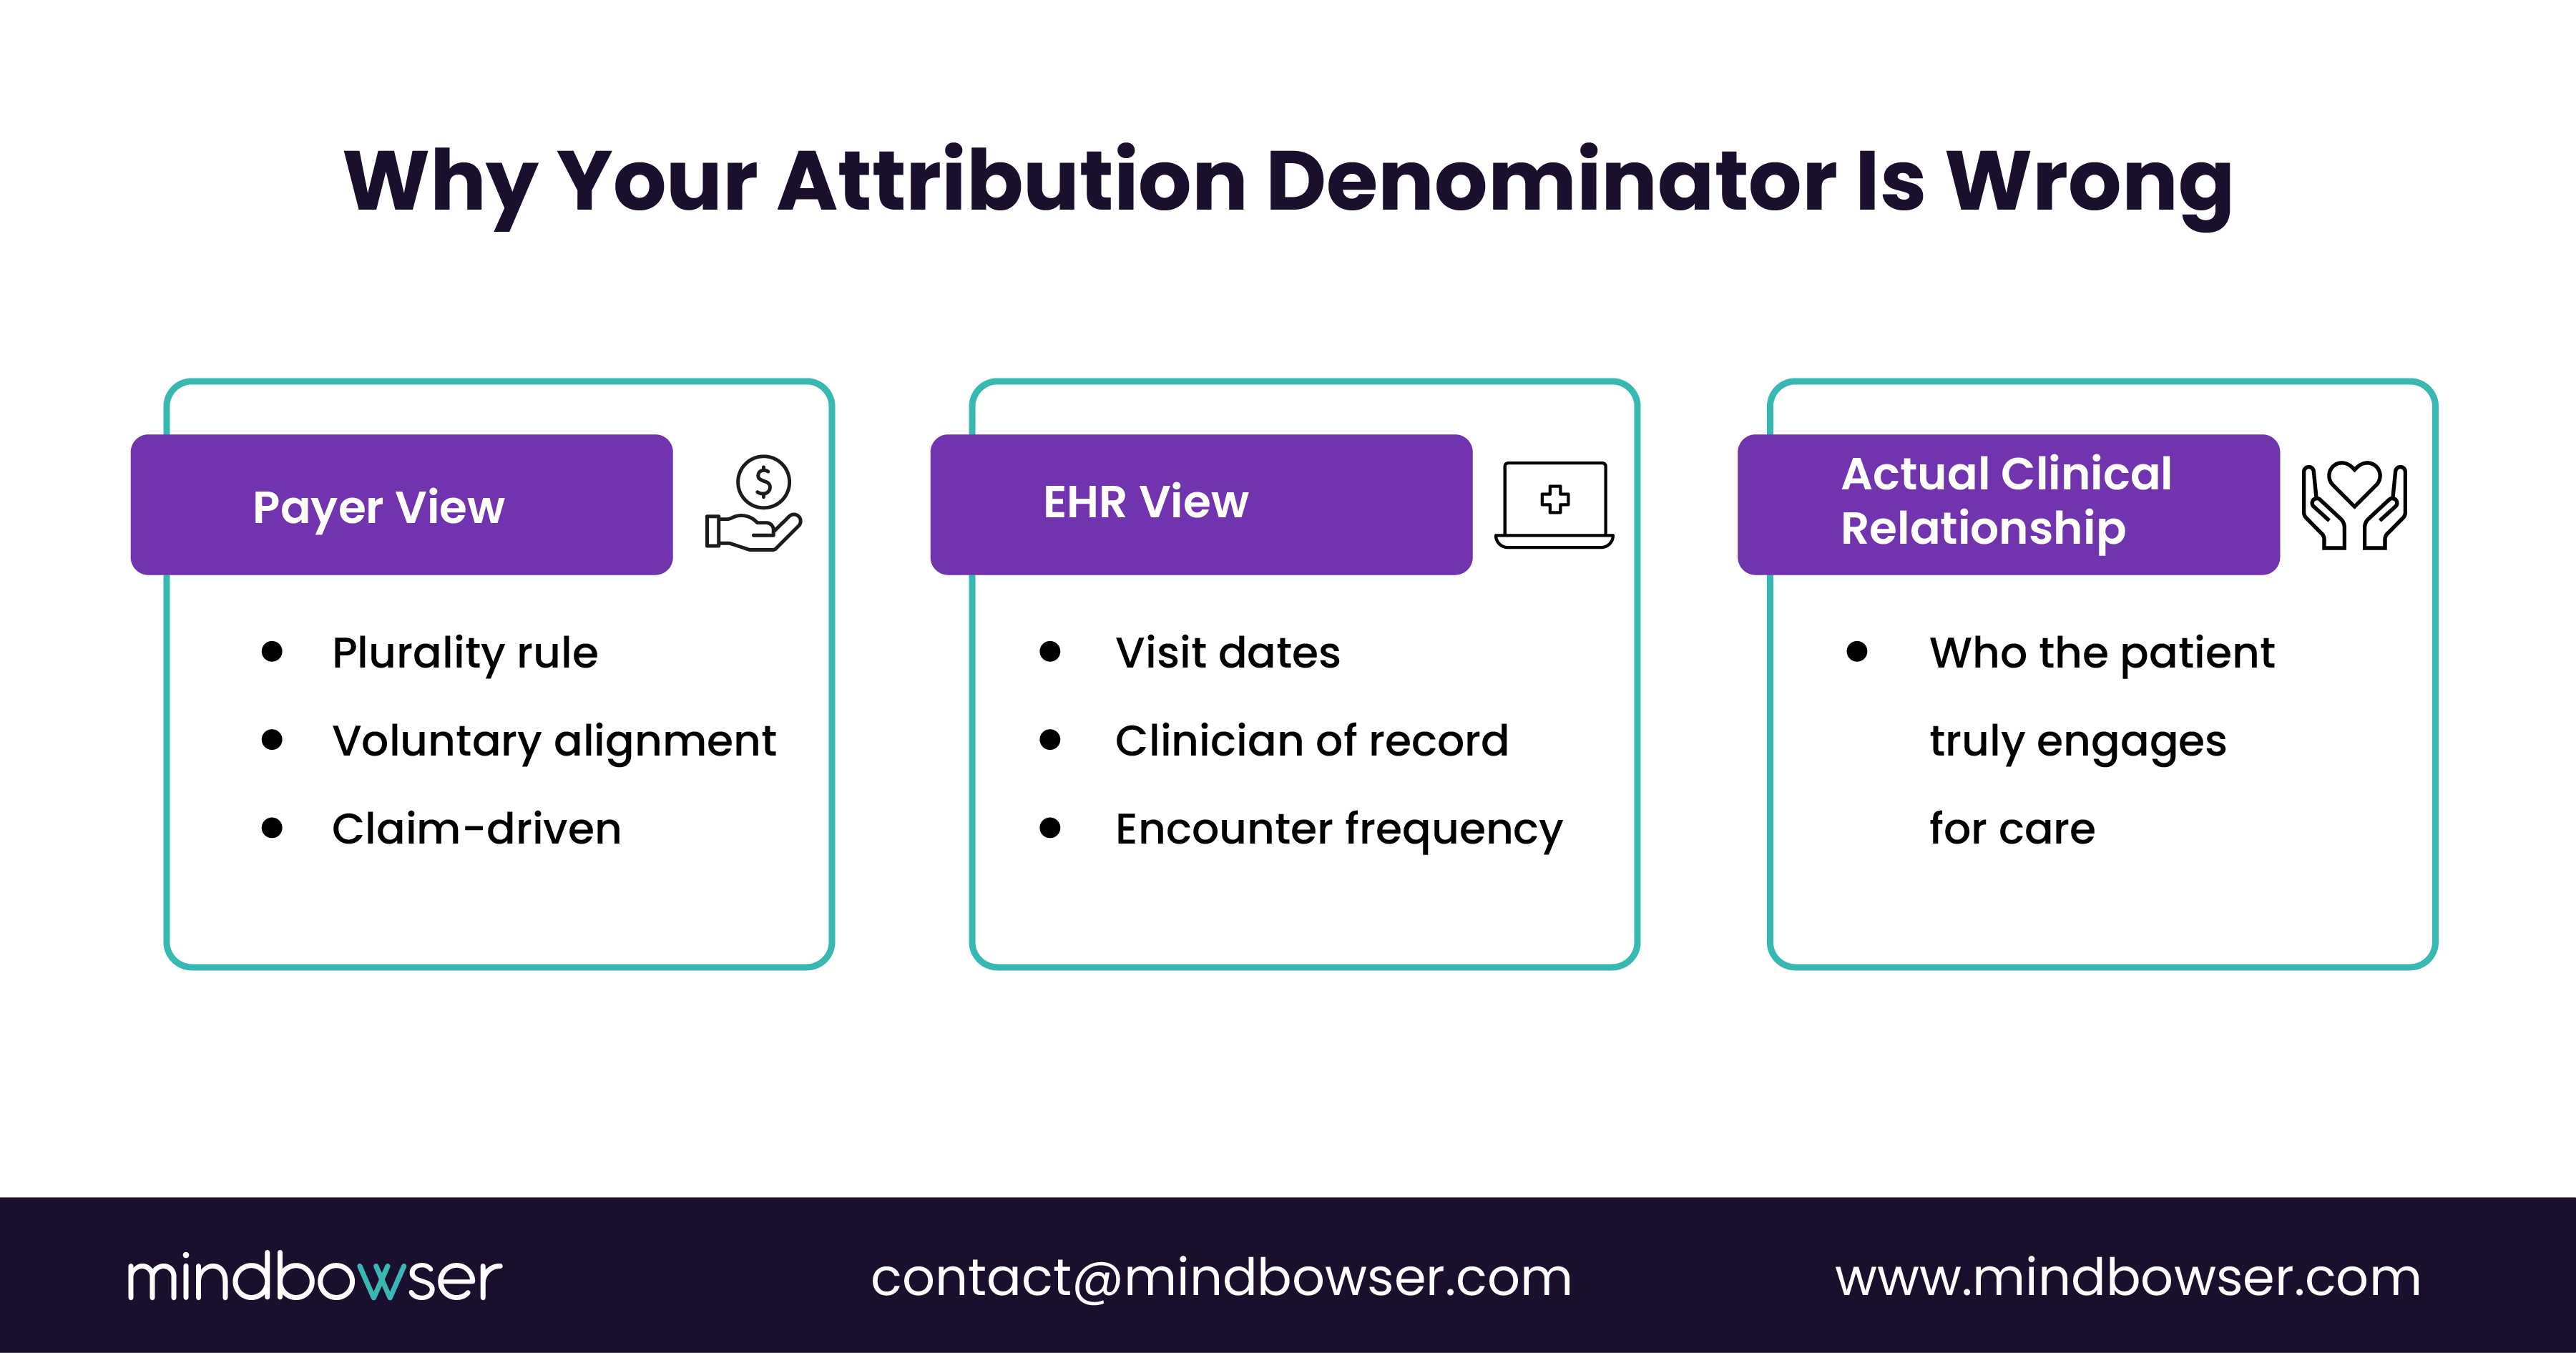
A. Myth 1: All payers define attribution the same way
- One payer uses a plurality of primary-care visits.
- Another uses prospective assignment.
- A third requires voluntary alignment.
The result is a blended panel full of mismatched logic, double-counted members, and patients assigned to clinicians they have not seen in years. This fragmentation is exactly where HealthConnect CoPilot helps normalize each payer’s file into a unified, FHIR-based attribution service.
B. Myth 2: Attribution lists reflect real clinical relationships
Attribution often follows claims patterns rather than true continuity of care.
Patients with complex needs may see specialists more than PCPs, leading to skewed assignment.
Behavioral health patients may rarely appear in the EHR but may still be on a payer’s quarterly panel.
Using AI Medical Summary, care teams can immediately understand a patient’s actual engagement pattern, PCP, specialist, behavioral health, and urgent care, so clinical ownership is assigned accurately.
C. Myth 3: The denominator doesn’t change much during the year
Attribution volatility is the silent killer of shared savings.
Panels shift because of:
- New members choosing different PCPs
- Misclassified claims
- Retroactive eligibility changes
- Patients moving between networks
This volatility reshapes your settlement math by thousands of dollars per member.
When AI Readmission Risk and CarePlan AI run on shifting panels, outreach becomes inconsistent, and quality gaps reopen.
II. Lock Strategy: How to End Attribution Volatility by Q2
Attribution volatility destroys financial predictability. The solution is not another spreadsheet; it’s a lock strategy grounded in CMS rules, payer contract logic, and a clean internal data pipeline. By Q2, every ACO can achieve a stable, defensible denominator by following three steps.
Step 1: Normalize all attribution inputs into one governed “panel service”
Payers provide rosters in different formats, with varying rules and update frequencies.
- Your EHR reflects visit patterns.
- Eligibility files show mid-year churn.
A lock strategy starts by consolidating all of this into a single source of truth, updated daily and versioned like a product.
This is where HealthConnect CoPilot acts as the FHIR-based ingestion and reconciliation engine, mapping payer logic, reconciling NPR (Not Previously Reported). members, and exposing panel deltas to analytics teams.
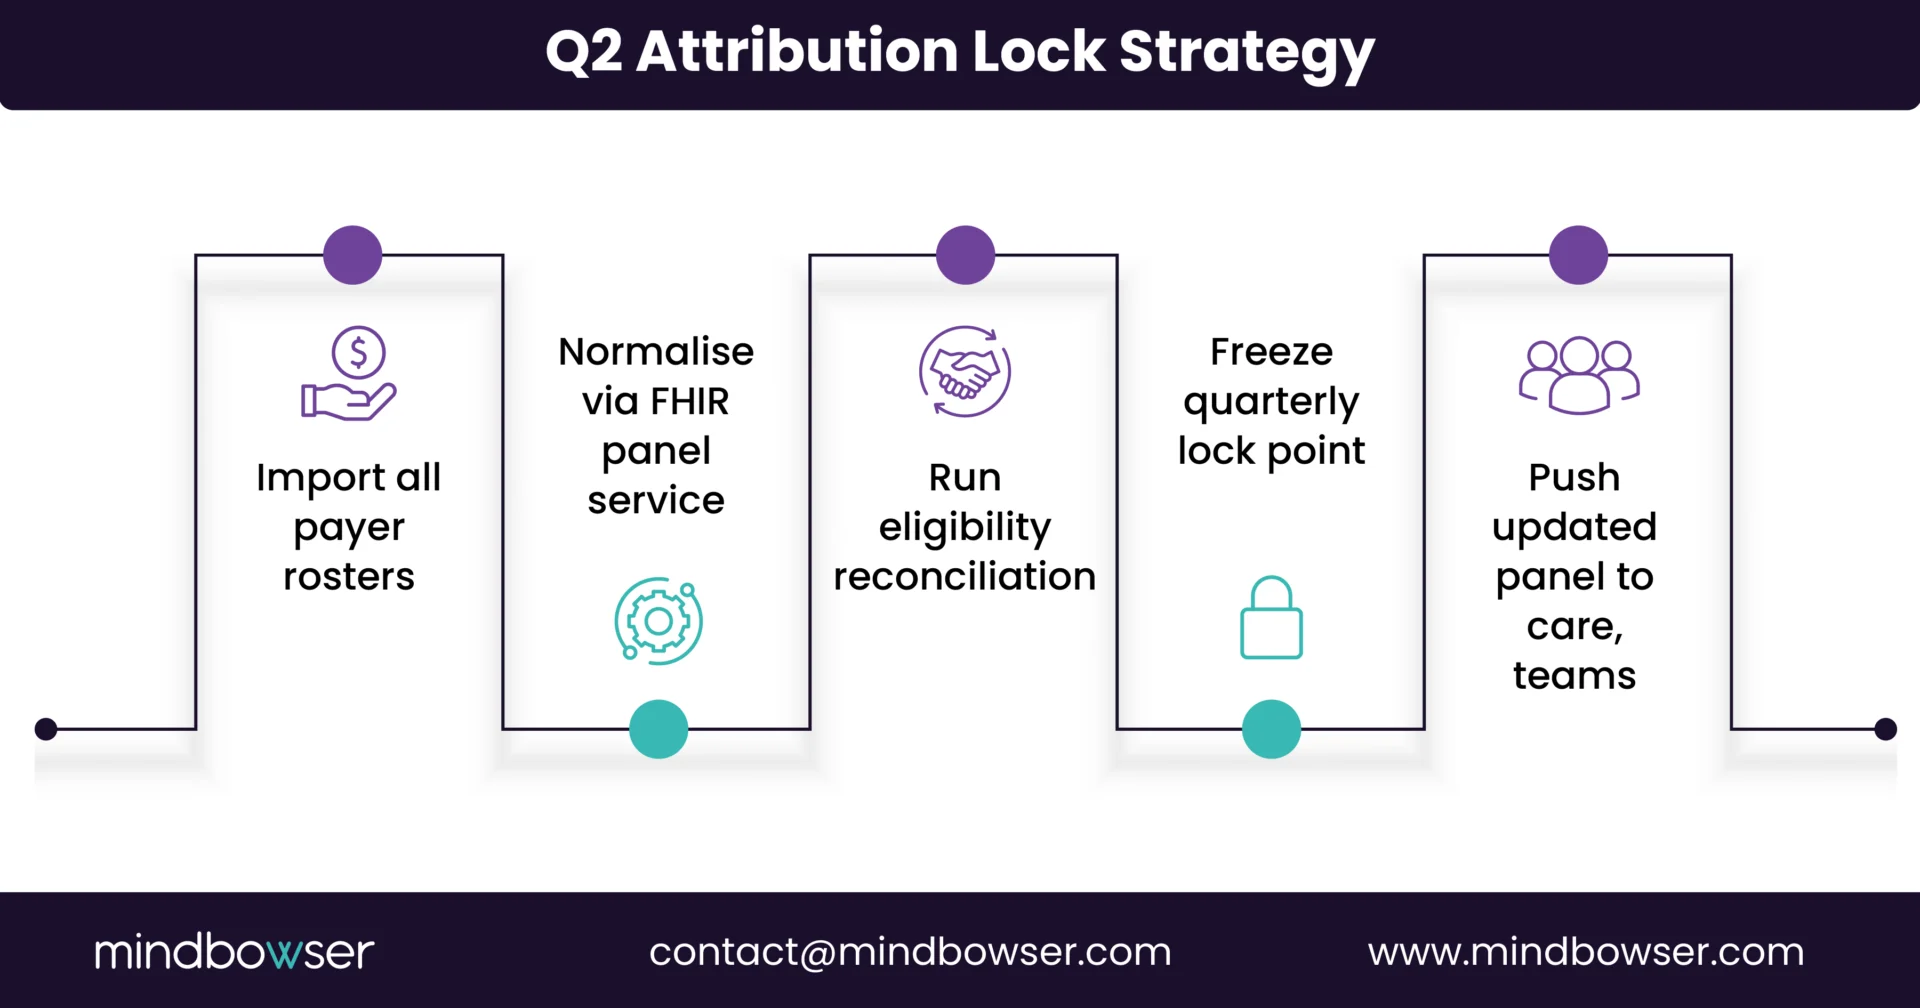
B. Step 2: Establish quarterly lock points based on contract rules
Most ACOs fail because their “locked” panel is actually a moving target.
A proper lock strategy uses:
- Prospective assignment for stable forecasting
- Preliminary prospective + retrospective reconciliation for MSSP contract
- Voluntary alignment as a controllable lever during outreach campaigns
- Eligibility freeze windows for commercial payers
By Q2, you can freeze a high-confidence denominator for forecasting shared savings, expected quality reach, and care management staffing.
Voluntary-alignment workflows can be automated through CarePlan AI, nudging patients to confirm their PCP relationship digitally.
C. Step 3: Align clinical workflows to the locked panel
A panel is only as real as the clinicians’ ability to work from it.
Once a denominator is locked, your care teams should see:
- Real-time daily changes (adds/drops)
- Which newly attributed patients carry the highest medical risk
- Which patients are missing recent visits
- Which individuals are likely to drive readmissions
This is where AI Readmission Risk, AI Medical Summary, and RPMCheck AI plug-in are used.
Each new attributed patient is automatically summarized, risk-stratified, and routed to the right care team with the appropriate outreach plan.
Assess your readiness for value-based margin before risk contracts assess you.
III. Dashboard Preview: What Attribution Looks Like When It Finally Works
A stable attribution model should not live inside spreadsheets or quarterly emails. It should appear as an executive-grade product that your ACO can run operations against every single day. Below is what a modern attribution dashboard includes when engineered correctly.
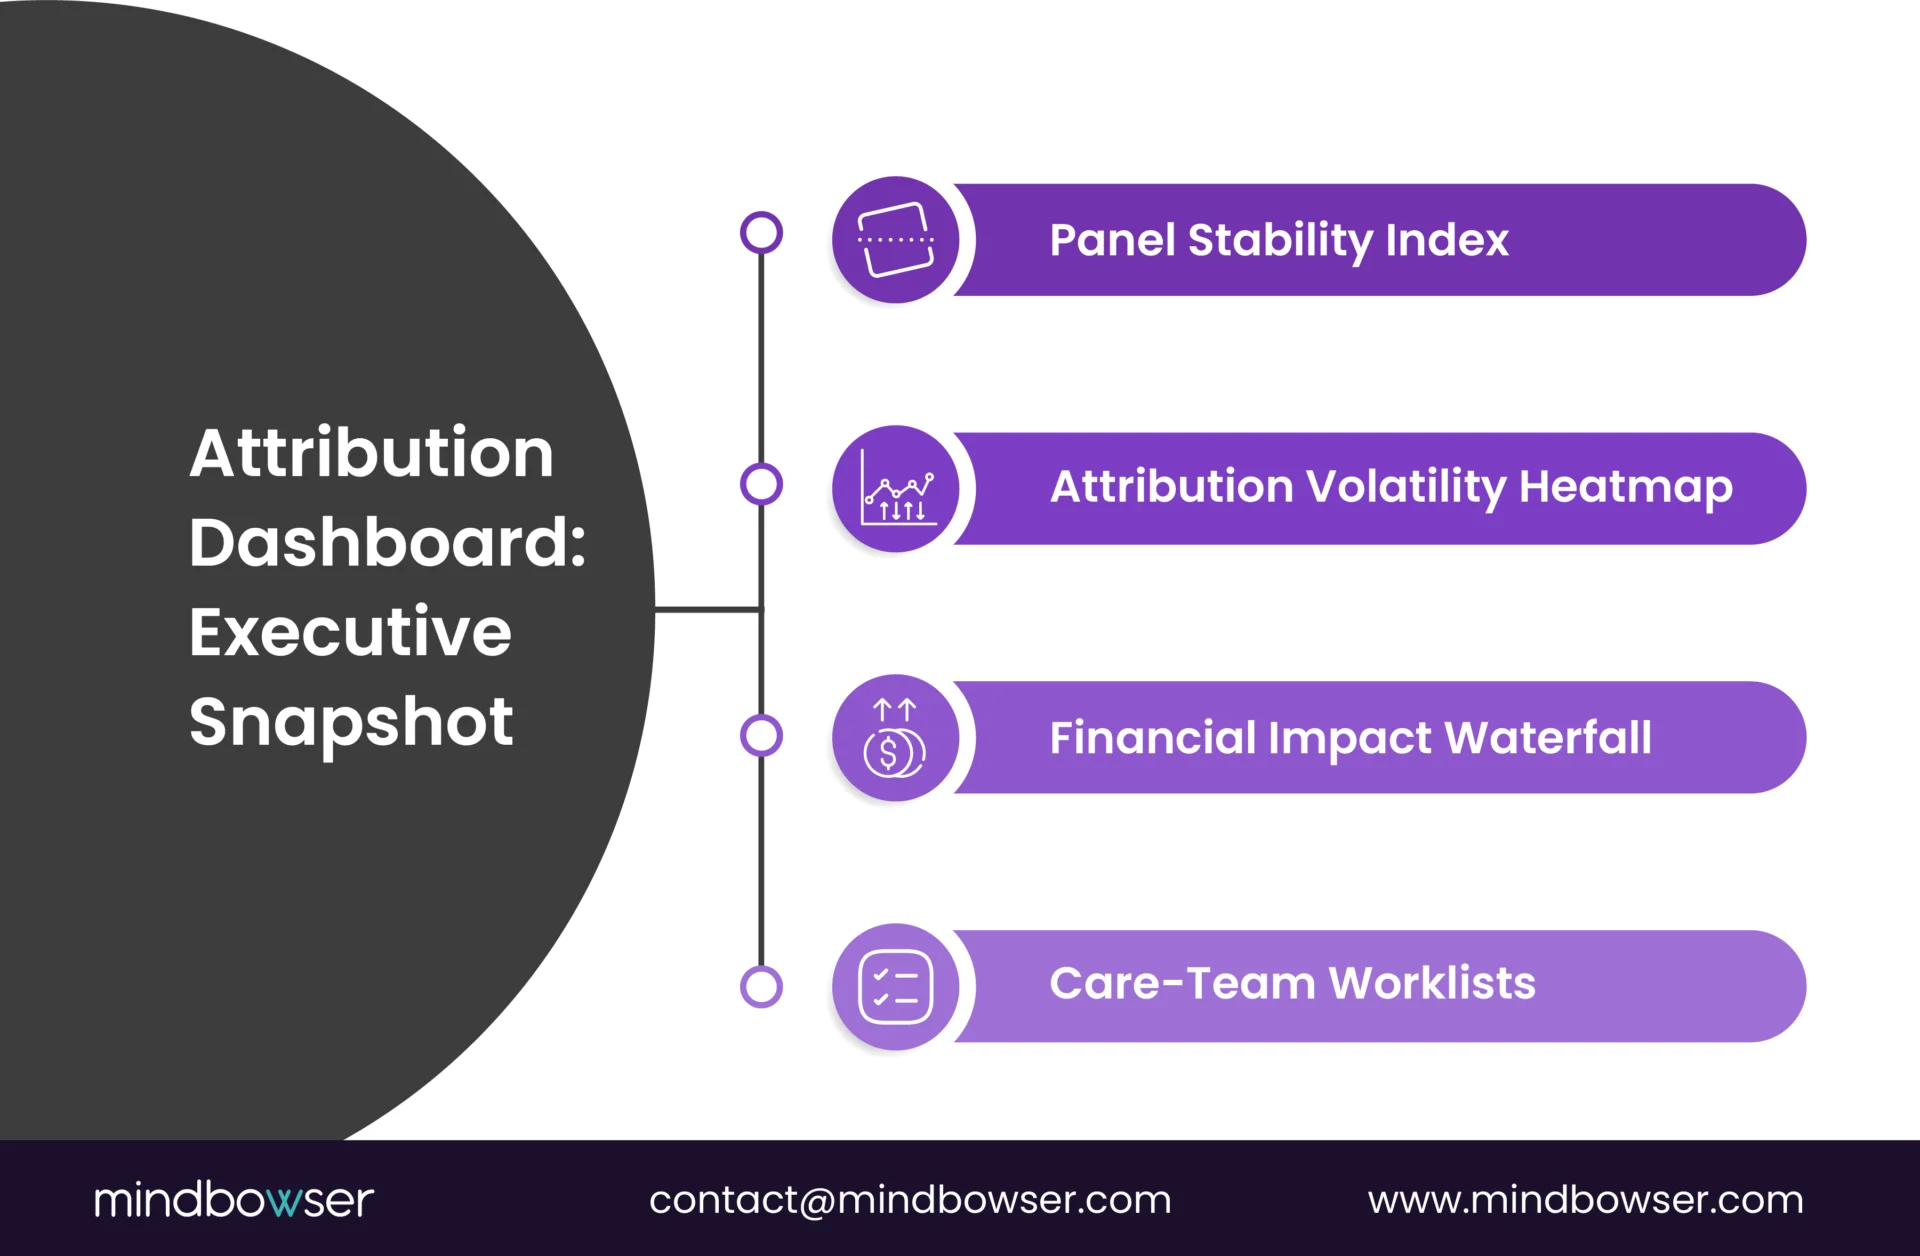
A. Panel Stability Index (PSI)
Executives need one metric that instantly answers:
“Is our denominator holding steady?”
The PSI tracks:
- Monthly attribution churn
- Members gained vs members lost
- Contract-level stability (MSSP, MA, commercial)
- Variance against baseline forecasts
With HealthConnect CoPilot, PSI updates in near real time because payer files, EHR events, and eligibility shifts flow through a unified data fabric.
B. Attribution Volatility Map
An interactive heatmap highlights contracts or regions where the denominator is unstable.
Common red zones include:
- Counties with new network entrants
- Clinics with high out-of-network leakage
- Specialists are seeing a plurality of visits
- MA members shifting PCPs during enrollment season
This is where AI Medical Summary and AI Readmission Risk help care teams understand which newly attributed patients carry the heaviest downstream utilization.
C. Financial Impact Waterfall
The dashboard quantifies how attribution accuracy affects projected shared savings:
- Locked denominator
- Retro adjustments
- Voluntary alignment shifts
- High-risk member additions
- Quality-measure reach gains/losses
The waterfall makes attribution’s financial impact visible to CFOs and actuaries, which is critical for MA and MSSP forecasting.
D. Care-Team Worklist Integration
The final view: a clinician-ready worklist that filters directly by attribution status.
Examples:
- “Newly attributed in the last 7 days.”
- “Attributed but no visit in 12 months.”
- “Attributed with open care gaps.”
- “High-risk attributed patients are likely to be readmitted in 30 days.”
These workloads are powered by CarePlan AI, AI Readmission Risk, and RPMCheck AI, ensuring every attributed patient enters care pathways within days, not months.
Organisations with high-fidelity attribution dashboards were able to pinpoint under-engaged but high-cost members, improving referral completion and reducing avoidable acute events. Clear panel visibility directly supported cost-navigation workflows and care transitions.
The Fixable Foundation of Every VBC Contract
Most value-based care failures do not stem from gaps in care management or quality blind spots.
They start earlier with the denominator. When attribution is unstable, every downstream workflow becomes reactive: forecasting is wrong, outreach is misaligned, and risk scores drift from the clinical reality your teams see every day.
But when attribution is engineered as a data product rather than a quarterly spreadsheet, everything changes.
- Panels stabilise.
- Quality reach improves.
- Care teams operate with clarity.
- Financial leaders finally see predictable shared-savings curves instead of year-end surprises.
With a unified attribution fabric powered by HealthConnect CoPilot, AI Medical Summary, AI Readmission Risk, and CarePlan AI, ACOs can turn attribution from a constant fire drill into a strategic advantage by Q2.
If attribution is the denominator behind every dollar and every quality score, how long can your ACO afford to run it without a lock strategy and a real-time attribution data service?
Patient attribution is the process of assigning a patient to a provider or organization responsible for their cost and quality outcomes. CMS and commercial payers use different attribution rules, often based on primary care visits, voluntary alignment, or prospective assignment. Accurate attribution defines your financial denominator, drives quality measurement, and determines who your care teams must engage throughout the year.
Volatility shifts your accountable population throughout the year. New high-risk members may appear without warning, while long-engaged patients drop off due to eligibility or claims patterns. This instability disrupts outreach, reduces the reach of quality measures, and creates forecasting errors that directly affect shared-savings calculations. Stable attribution, supported by a lock strategy, makes performance predictable and prevents avoidable losses.
Most ACOs need a unified attribution “data product” that ingests payer files, normalizes each
contract’s logic, reconciles discrepancies, and updates panels daily. A FHIR-based architecture, such as HealthConnect CoPilot, helps create this single source of truth. AI layers like AI Medical Summary, CarePlan AI, and AI Readmission Risk automatically surface risk, gaps, and clinical context for newly attributed members.
Quality measurement depends on knowing exactly which patients you are accountable for. Accurate attribution determines who must be included in HEDIS, Stars, and dQM reporting. Stable panels allow population-health teams to plan outreach, close gaps, schedule visits, and reduce exclusions. Without firm attribution, quality programs operate on guesswork and underperform despite strong clinical teams.
Clinicians need attribution embedded in their daily workflow—not in spreadsheets. A modern dashboard shows newly attributed patients, high-risk members, open care gaps, and patients overdue for visits. Tools like CarePlan AI and AI Readmission Risk automatically push actionable insights into care-team worklists. This enables timely interventions and reduces readmissions across the attributed panel.