BLOGS
BLOGS  NEWSROOM
  CASE STUDIES
  WEBINARS
  PODCASTS
  ASSET HUB
  EVENT CALENDAR


The simple definition of “analytics” is a study of analysis. An analysis is a process of conducting a detailed examination of the elements of something. The modern term data analytics is formed by putting together the terms data and analytics.
Therefore, data analytics refers to a tool or method used to gain valuable insights into the inner mechanisms of a specific activity or phenomenon. Usually, the term data analytics is used in the context of businesses and their activities. By performing data analytics using various tools, companies can gain meaningful insights from the large datasets they have collected.
This will enable them to provide responses and services specifically catered to their customers’ needs. The importance of data analytics trends is more evident in recent years. Data analytics is often abbreviated to analytics, and it is essential for large organizations and businesses of all sizes.
However, due to the multitude of available data analytics platforms, it can be quite challenging to choose one for your organization. In such a case, you should consider using a data analytics consulting company like Mindbowser.

What Are The Various Branches Of Data Analytics, And How Did They Originate?
Though data analytics might seem like a product of modern technology incepted due to the exponential rate at which we generate data every day, a business’s first use of data analytics can be traced back to the early 19th century.
The first documented use of data analytics was when Henry Ford measured the speed of the assembly line to gauge the efficiency of his manufacturing plant. Before Ford, Fredrick Winslow Taylor used data analytics to initiate time management exercises. Soon, with the arrival of the era of computers and other digital technologies, computers became decision-making support systems.
As a result, there was significant growth in the data we were generating. Therefore, data analytics started to receive more widespread global attention. Ever since then, the amount of data we generate daily has also increased at an exponential rate.
The most significant growth in adopting data analytics was seen with the advent of Big Data, Data Warehouses, and the Cloud. These new technologies not only played a role in the increased adoption of data analytics but also contributed significantly to the evolution of data analytics and its journey to what it has become today.
Let us look at various data analytics components, when they were first used, and how they evolved.

Statistics And Computers
Traditional descriptive statistics is one of the most vital foundations of modern data analytics. Statistics have been used for various analytics purposes since ancient Egypt. For decades, governments worldwide have been using statistics to plan various activities, including censuses and taxation.
The development of the computer and the evolution of computing technologies have also dramatically improved the process of data analytics. In 1880, before the use of computers, the US Census Bureau took seven years to process all the information they had collected and complete their final report. Today, it can be done in a matter of days.
Relational Databases And Non-Relational Databases
Invented by Edgar Codd in the 1970s, relational databases gained widespread popularity just a decade later. As relational databases (RDBMS) improved over time, users could write in SQL and retrieve data from their databases. SQL allowed organizations to analyze their data on demand, and even today, it is widely used.
When Larry Page and Sergey Brin designed Google in the 1990s, they, too, based their search engine on the same principle. Google was designed to search for a specific website while processing and analyzing big data stored in various physical locations.
Data Warehouses
In the late 1980s, as the costs of hard drives reduced, the amount of data collected by users began to grow significantly. During this time, an architecture called data warehouses was developed to help transform data from operational systems into decision-making systems.
Unlike relational databases, data warehouses are optimized for quick response time to queries and are usually part of an organization’s mainframe network.
Business Intelligence
Though the term business intelligence (BI) was first used in 1865, only in 1989 was it adapted by Howard Dresner at Gartner to describe making better business decisions through searching, gathering, and analyzing the accumulated data that an organization saved.
Today, business intelligence serves as a description of decision-making based on new and innovative data technologies. Large organizations adopted BI as a way of analyzing customer data systematically, but over time, it became one of the most vital steps that are taken before making any business decision.
Data Mining
Data mining is the process of identifying hidden patterns within large datasets that first began in the 1990s. Data mining became more popular due to the evolution of database and data warehouse technologies. Advanced features in these technologies allowed organizations to store more data while analyzing it quickly and efficiently.
Data mining and its non-traditional methods provided surprising and beneficial results to organizations. It allowed them to predict the potential needs of customers based on trends identified in the analysis of their historical purchasing patterns.
Big Data
The advent of big data is a relatively recent phenomenon, but it has played the most significant role in the evolution of data analytics. The name big data was coined by Roger Magoulas in 2005 when he described a massive amount of data that was almost impossible to cope with using the business intelligence tools at the time.
The same year, open-source software that could process big data, called Hadoop, was developed. Hadoop was an incredibly powerful software that could process structured and unstructured data streamed in from almost any digital source.
Cloud Analytics
Although the cloud and being able to store data on the cloud feels like a very recent phenomenon, the concept was first introduced in 1997 by Emory University professor Ramnath Chellappa. He accurately described the cloud as “a new computing paradigm where the boundaries of computing will be determined by economic rationale rather than technical limits alone.”
Two years later, in 1999, Salesforce provided us with an early example of successful analytics implementation of a cloud computing architecture.
As businesses gained a better understanding of the potential of cloud services, they gained widespread popularity. Since 1999, cloud computing has grown significantly and can now store large amounts of data, handle multiple projects, and be used by multiple users simultaneously.
Our Projects
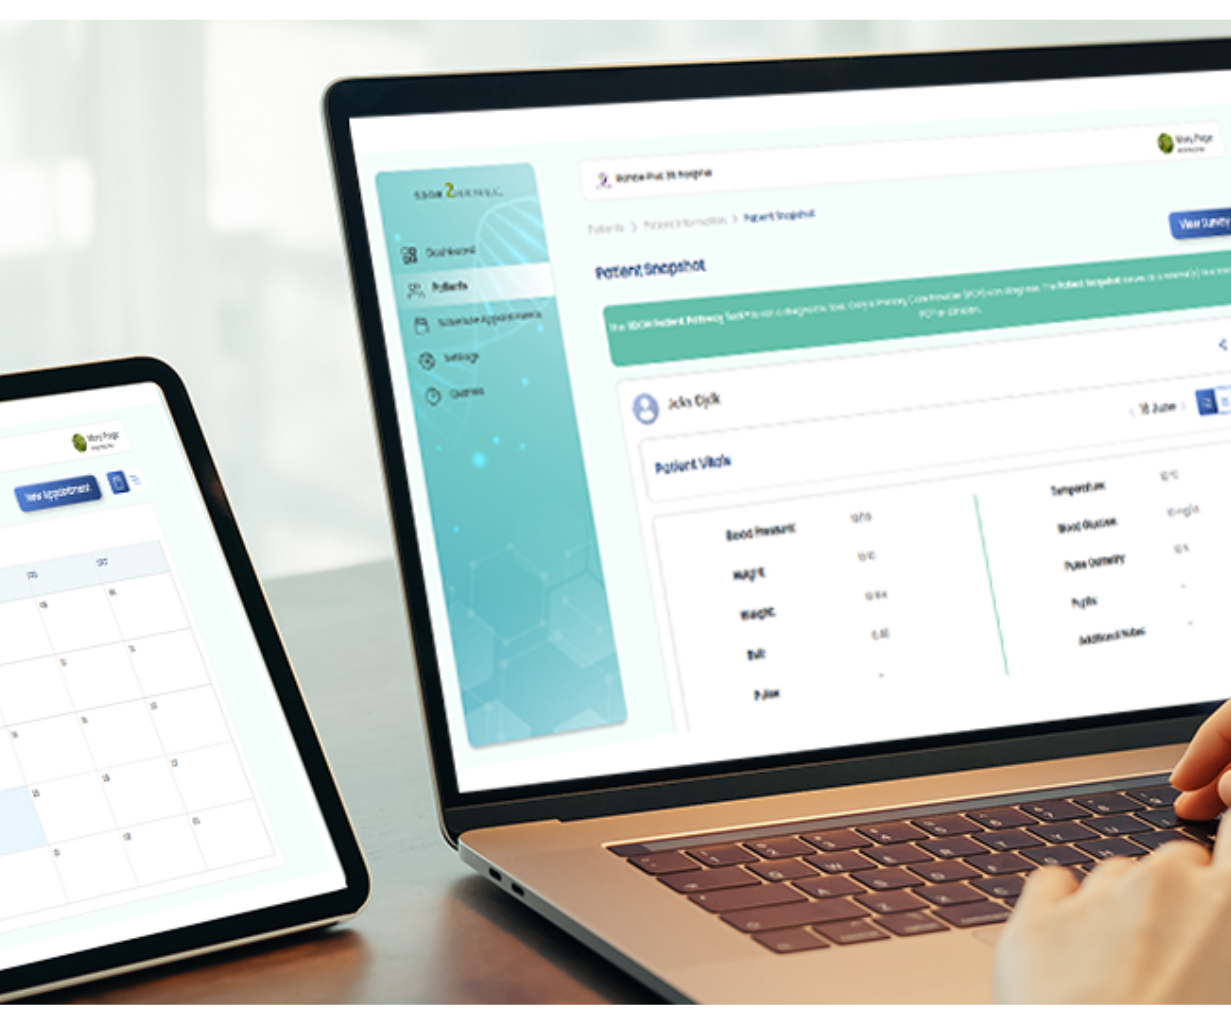
Developed a Platform Providing Centralized Access to Survey Data from Patients
We created a user-friendly platform for a healthcare platform combining medical and non-medical parameters through a digital survey. The platform helps in identifying the SDOH determinants of the patients and mitigating them, helping patients to live healthy and long lives. Discover how we developed the efficient platform while addressing various factors involved in their objective.
What Is Exploratory Data Analysis, And How Does It Work?
Now that we have understood the importance of data analytics and what it means, and the components that fall under its broad umbrella, it is time to delve deeper into a data analytics technique that will help your organization to maximize its pattern-recognizing capabilities.
Exploratory data analytics is a statistical approach used to analyze and produce descriptive graphical summaries. The most significant advantage of using EDA instead of a statistical model is that, with EDA, analysts can foresee what the data can reveal beyond formal modeling.
When using EDA to analyze your data, you can use your data as it is without having to make any assumptions. It further validates and expands the practice of using graphical methods to explore data. Since it gains all its insights from well-known statistical theories, they are quite easy to decipher. If a large dataset is unsuitable for formal statistical analysis, you can use EDA to derive hidden trends within the data.
The primary objective of analyzing data using EDA is to study a dataset without making assumptions about it. It is critical to do this because it allows data analysts to authenticate any assumptions they have made while devising the problem or operating a particular algorithm.
This will enable analysts to recommend new and innovative schemes that would not have been possible. While implementing EDA, you are essentially using inductive reasoning to obtain results.
It can also help you better understand the relationship between variables, detect issues such as data entry errors, identify the basic data structure, test your assumptions, and gain new data insights. However, the most vital aspect of implementing EDA is that it has the potential to uncover hidden information that might further open up new areas for research.
Here are some of the most effective methods to carry out exploratory data analytics.

Univariate Visualization
In this type of analysis, the dataset only consists of one variable. It is mainly used to trace and report patterns in the data.
Bivariate Visualization
This is used to determine the relationship between two variables and to help you understand the significance of those relationships.
Multivariate Visualization
When datasets’ complexity and size increase, a multivariate analysis is used to trace the relationships between different fields. It also significantly reduces the specific types of errors. However, this approach is unsuitable for small datasets.
Dimensional Reduction
This type of analysis helps analysts deduce which parameters contribute to the maximum variation in results and enables fast processing by reducing the volume of data.
Data analysts can use the methods mentioned above to understand the problem at hand adequately. They can then select the appropriate models to corroborate the generated data. Once they have studied the data distribution, they can finally check if there is any missing data and find ways to solve it.
How Can Data Analytics Drive Innovation And Give Birth To New Trends?
If the interdependencies between people, institutions, entities, and technological processes are made more apparent through the study of data relationships, it could potentially drive organizations to develop innovative new methods and business strategies.
Organizations can use tools such as exploratory data analysis, business intelligence, and data management to understand better how changing one function will affect another process.
In every industry, market leaders want faster decision cycles and to reduce delays in researching new approaches and implementing them. However, the biggest problem that most organizations face is that as they move towards being more data-driven, their instincts or gut feelings are taking the backseat.
Without natural human instincts guiding businesses, their potentially innovative ideas can be buried under a mass of data and other research resources. But with further advancements in cognitive analytics, organizations have started to use their data insights to align their research and financial resources behind innovative ideas.

Another field of data analytics that has immense potential to give birth to innovative ideas is cloud computing. Cloud services can provide organizations with a high degree of flexibility to adjust their systems according to the new ideas they are testing.
It also allows them to create “what if” simulations and perform data discovery. Numerous organizations are using cloud platforms to develop data sandboxes for users to test their new ideas. This enables them to experiment without waiting for IT to acquire and configure on-premise resources that support experimentation.
The cloud environment has also turned into a space where many organizations are experimenting with open-source tools such as Apache Hadoop and Spark, to analytical tools and languages such as R and Python.
Cloud platforms ensure that an organization’s innovative ideas are not killed off due to a lack of in-house infrastructure before they can flourish.
Discover The Hidden Opportunities In Your Data
The Top Tools In Data Analytics That You Must Know About
As the market demand for data analytics services is increasing rapidly, many new data analytics tools have emerged. Each of these tools fulfills various data analytics functionalities. Most of the tools mentioned below are either user-friendly or open-source. Here are the top tools in the data analytics market.
R Programming
The R programming language is one of the top data analytics tools for statistics and data modeling. An added benefit of using R is that it can be compiled and run on various platforms such as UNIX, Windows, and macOS. It also provides tools that automatically install all packages as per user requirements.
Python
Regarding the top data analytics tools used today, Python is right up there with R. It is a programming language that is exceptionally easy to read, write, and maintain. It also offers various Machine Learning and data visualization libraries such as TensorFlow, Matpotlib, Pandas, Keras, etc. In addition to its vast library, Python can be assembled on any platform, like an SQL server, a MongoDB database, or JSON.
Tableau Public
This free software connects to any data source, such as Excel, corporate data warehouse, etc. Then, it creates visualizations, maps, dashboards, etc., with real-time updates on the internet.
Qlikview
Qlikview delivers results to users significantly faster than other data analytics and offers in-memory data processing. Its data association and visualization features allow you to compress data to almost 10% of its original size.
SAS
This is a very easily accessible tool and is capable of analyzing data from a variety of sources. It is a programming language that offers an ideal data manipulation and analytics environment.
Microsoft Excel
Excel is still one of the most widely used data analytics tools. Though it is usually used for the client’s internal data, it can analyze tasks that summarize the data with a preview of the pivot tables.
RapidMiner
RapidMiner is a highly robust, integrated platform capable of integrating various data source types such as Access, Excel, Microsoft SQL, Tera data, Oracle, Sybase, etc.
KNIME
Konstanz Information Miner is an open-source data analytics platform that allows users to analyze and model their datasets. Since it has the added benefit of visual programming, KNIME provides a platform for reporting and integration with the help of its modular data pipeline concept.
OpenRefine
This software by Google is also known as GoogleRefine, and it will help users to clean up their data before they perform data analysis. Its primary purpose is to clean messy data and transform and parse data from websites.
Apache Spark
Apache Spark is one of the largest data processing engines currently available. Compared to other tools, Apache Spark can execute applications in Hadoop clusters 100 times faster in memory and ten times faster on disk. It is also widely used for data pipelines and Machine Learning model development.
Meet Our Data Scientist
Sandeep Natoo
Sandeep is a certified, highly accurate, and experienced Data Scientist adept at collecting, analyzing, and interpreting large datasets, developing new forecasting models, and performing data management tasks. Sandeep possesses extensive analytical skills, strong attention to detail, and a significant ability to work in team environments.
Get Free ConsultationWhat Does The Future Of Data Analytics Hold?
Since it first started, data analytics has been continuously evolving. When it started, data analytics only dealt with descriptive analytics, which merely described datasets. Data analytics has come a long way since then. Today, data analytics can predict future outcomes through predictive analytics.
Recent advancements in technologies such as Artificial Intelligence (AI), cloud computing, the Internet of Things (IoT), and Machine Learning have significantly contributed to data analytics’s enormous growth and immense popularity.
Let us discuss some of the platforms and technologies that will play a critical role in the future of data analytics.
Augmented Analytics
The integration of Machine Learning and natural language processing into data analytics and business intelligence is augmented analytics. Starting this year, this form of analytics will play an enormous role in analyzing data in the future.
Since augmented analytics can search raw data for valuable parts of the analysis, it can also automate various parts of the process. The use of augmented analytics especially makes the process of data preparation significantly more straightforward.
Relationship Analytics
The data analytics tools that we have access to today can be used to find the relationship between a pair of variables. However, one of the biggest problems analysts face today is that the current data analytics solutions analyze data in isolation.
With the help of relationship analytics, organizations can break down multiple data sources and connect them to analyze their data as a whole rather than in isolation. This will enable companies to draw more comprehensive insights from their data analytics processes.
Decision Intelligence
The future of data analytics is not just limited to new platforms that perform the same functions better. Still, it is also about new intelligent platforms that can help decision-making. Decision Intelligence is a robust new platform that integrates the fields of social science, managerial science, and data science into one.
Its ability to draw information from various disciplines makes it an invaluable business decision-making asset to organizations. This intelligent platform will help your organization optimize its decision-making and add an extra level of quantitative analysis to it.
Continuous Analytics
A few years ago, analysts did not expect data analytics platforms to deliver insights in a few days or weeks. However, we can already see a drastic difference in the speed at which analytics tools can deliver insights today.
In the future, thanks to continuous analytics, we can expect these platforms to take full advantage of IoT devices and generate insights even faster. Organizations can shorten the window for data capture and analysis by continually analyzing data.
Conclusion
The proliferation of new technologies that augment and expand its functions has dramatically pushed data analytics to evolve. We will likely see AI enhancing the capabilities of data analytics shortly. Automating processes and implementing natural language processing in data analytics will be the most significant contributors to the growth and importance of data analytics in the years to come.
Since data analytics is an ever-changing field, it is crucial that organizations use the best data analytics platforms that are currently available. Mindbowser’s data analytics solutions can help your organization identify and obtain the most valuable and meaningful insights from your data. It will help you make the best of all the tools and platforms you have at your disposal and turn your data insights into competitive advantages.