

Power BI allows you to create dynamic and interactive dashboards that provide a real-time view of your data. We build quality visualizations, by adding filters and exploring data from multiple sources to provide valuable insights.

With Power BI we offer a wide range of customizable visualizations, including charts, graphs, maps, tables, and more. You can choose from different chart types, colors, and formatting to create compelling visuals that communicate data insights.

Power BI helps you dive deep into your data and analyze hidden patterns and trends. The interactive features enable you to understand specific data points, apply filters, and perform ad-hoc analysis, empowering you to make data-driven decisions.

There are a variety of data sources that Power BI can connect to seamlessly, including databases, spreadsheets, cloud services, and APIs. You can integrate data from multiple sources, transform, and shape it for detailed analysis.

Power BI’s Q&A feature allows you to ask questions about your data using natural language. This feature makes data exploration and analysis more accessible to users with varying levels of technical expertise which helps in seamless results.

The platform enables you to collaborate with your team by sharing reports and dashboards. You can publish your visualizations to the Power BI service or embed them in other applications, allowing stakeholders to access and interact in real time.

We provide professional services that provide predictive analytics using Power BI’s advanced analytics capabilities. They can help you incorporate predictive models, forecast future trends, and identify opportunities or risks in the data.

Consulting services can offer expert guidance and advice on utilizing Power BI effectively for data visualization. They can assess your business needs, design optimal data models, and recommend some best practices to achieve attractive results.

Professional services can customize Power BI to align with the business needs and branding. They can create custom visuals, themes, and templates to ensure your data visualization impacts your organization’s unique identity.

We assist in the seamless integration of Power BI with other business applications and data sources. Our experts can enable data flow between Power BI and your existing systems, ensuring a view of data for analysis.
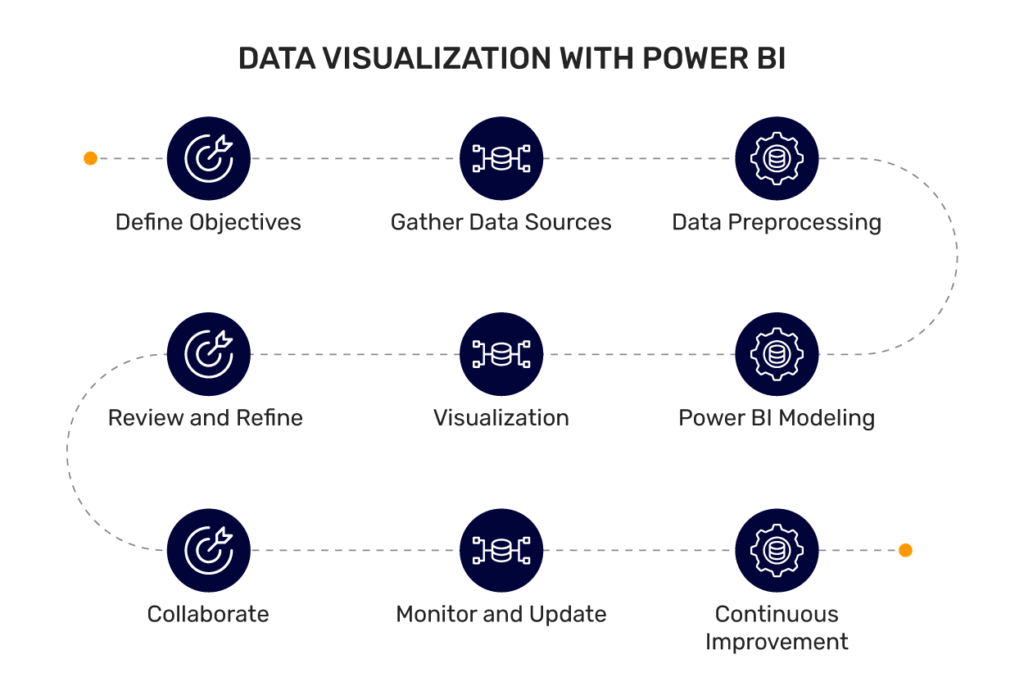
Power BI empowers the transformation of raw data into compelling visualizations. Follow these step-by-step processes for implementing impactful data visualizations with Power BI;

Launch Power BI Desktop or navigate to Power BI service. We connect all the data sources such as Excel or SQL databases. This will import the data into Power BI and start analyzing the structured data.

Once the data is imported, we select the appropriate visualization from the pane. To represent the data in a significant way, we apply fields from the data onto the canvas to create visuals such as charts, graphs, and tables.

Our experts assist you in enhancing your visualization by adding interactions and drill-through capabilities. We utilize Power BI’s advanced features, such as slicers, filters, and bookmarks, to enable users to interact dynamically.

The design expert organizes your visualizations into interactive dashboards and reports. By incorporating navigation features like bookmarks, buttons, and tooltips to enhance the user experience and have interactive visualizations.

With Power BI service you can publish your dashboards and reports to make them more accessible to the users. You can also embed your visualizations into other applications, websites, or portals to reach wider audiences.
Our experts put statistical and mathematical methods and tools to invent solutions that help companies automate processes, optimize entire operation processes and add extract business value with data.


Power BI offers a comprehensive set of features and functionalities that greatly enhance the effectiveness of data visualization. Its user-friendly interface and advanced analytical tools make it easy for users to create compelling visuals that effectively communicate insights.
Power BI provides a wide range of interactive visualizations, such as charts, graphs, maps, and tables. Users can easily create dynamic and engaging visuals that allow for exploration and interactions, enabling them to understand the data and observe trends and patterns.
Power BI seamlessly connects large data sources, including databases, cloud services, and online platforms. Users can collect data from multiple sources and combine it into a single, unified view, enabling comprehensive analysis and visualization.
The platform allows real-time data streaming and automatic refreshes, ensuring that visualizations are updated with the latest data. This capability is particularly useful for monitoring key metrics, tracking live updates, and making data-driven decisions in real time.
Power BI integrates advanced analytics abilities, such as machine learning and statistical modeling. Users can leverage these tools to evaluate deeper insights, perform predictive analytics, identify patterns, and detect anomalies in their data.
Power BI offers mobile apps for iOS and Android devices, enabling users to access their visualizations and insights anytime. The interactive designs ensure that visualizations adapt to different screen sizes, providing a seamless experience across devices.
Power BI is designed to handle large volumes of data and deliver faster performance. Whether dealing with unstructured or complex data, Power BI’s optimized engine ensures efficient processing and smooth visualization experiences.
To maximize the advantages of data visualization with Power BI, we at Mindbowser, consider implementing the following strategies;

We understand the specific insights businesses aim to achieve and focus on ensuring that the visualizations provide meaningful insights.

We design the visualizations according to the needs and preferences of the audience, using appropriate visual elements, and interactivity.

We select the most appropriate visualizations based on the type of data and the insights you want to convey to the audience.

Our experts leverage features like drill-down, filters, slicers, and tooltips to empower users to dive deeper into the data and gain insights.

We ensure that your visualizations are updated by regular updating and real-time streaming, allowing you to present the latest information to the audience.

We encourage continuous feedback from the users and stakeholders to understand their needs and improve the effectiveness of the visualizations.

A New York-based renowned nonprofit biomedical research organization wanted to develop a front-end (browser-based) application for the validation of user-submitted metadata via API calls to a server-side application. This also required a suitable API back-end to be created to develop the front end.
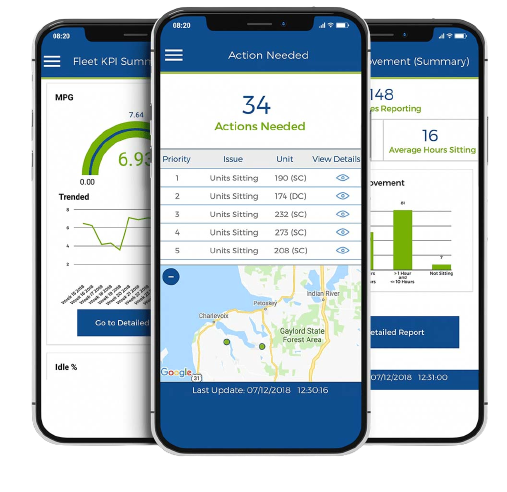
A US-based logistics data intelligence company planned to build a mobile app on iOS and Android platforms to provide critical data to fleet managers on the go. The mobile app is utilized for engaging and consulting with fleet managers within commercial vehicle fleet organizations, providing data to enhance decision-making, productivity, risk mitigation, and efficiency. We implemented a mobile web page deployment to mobile app overlay to save on cost and time for building the interface for multiple platforms.

This eCommerce platform started as an exclusively online Succulent delivery platform, delivering potted houseplants like pizza to doorsteps all over the United States. The company takes pride in bridging the gap between plants and people, offering products and services in real-time.
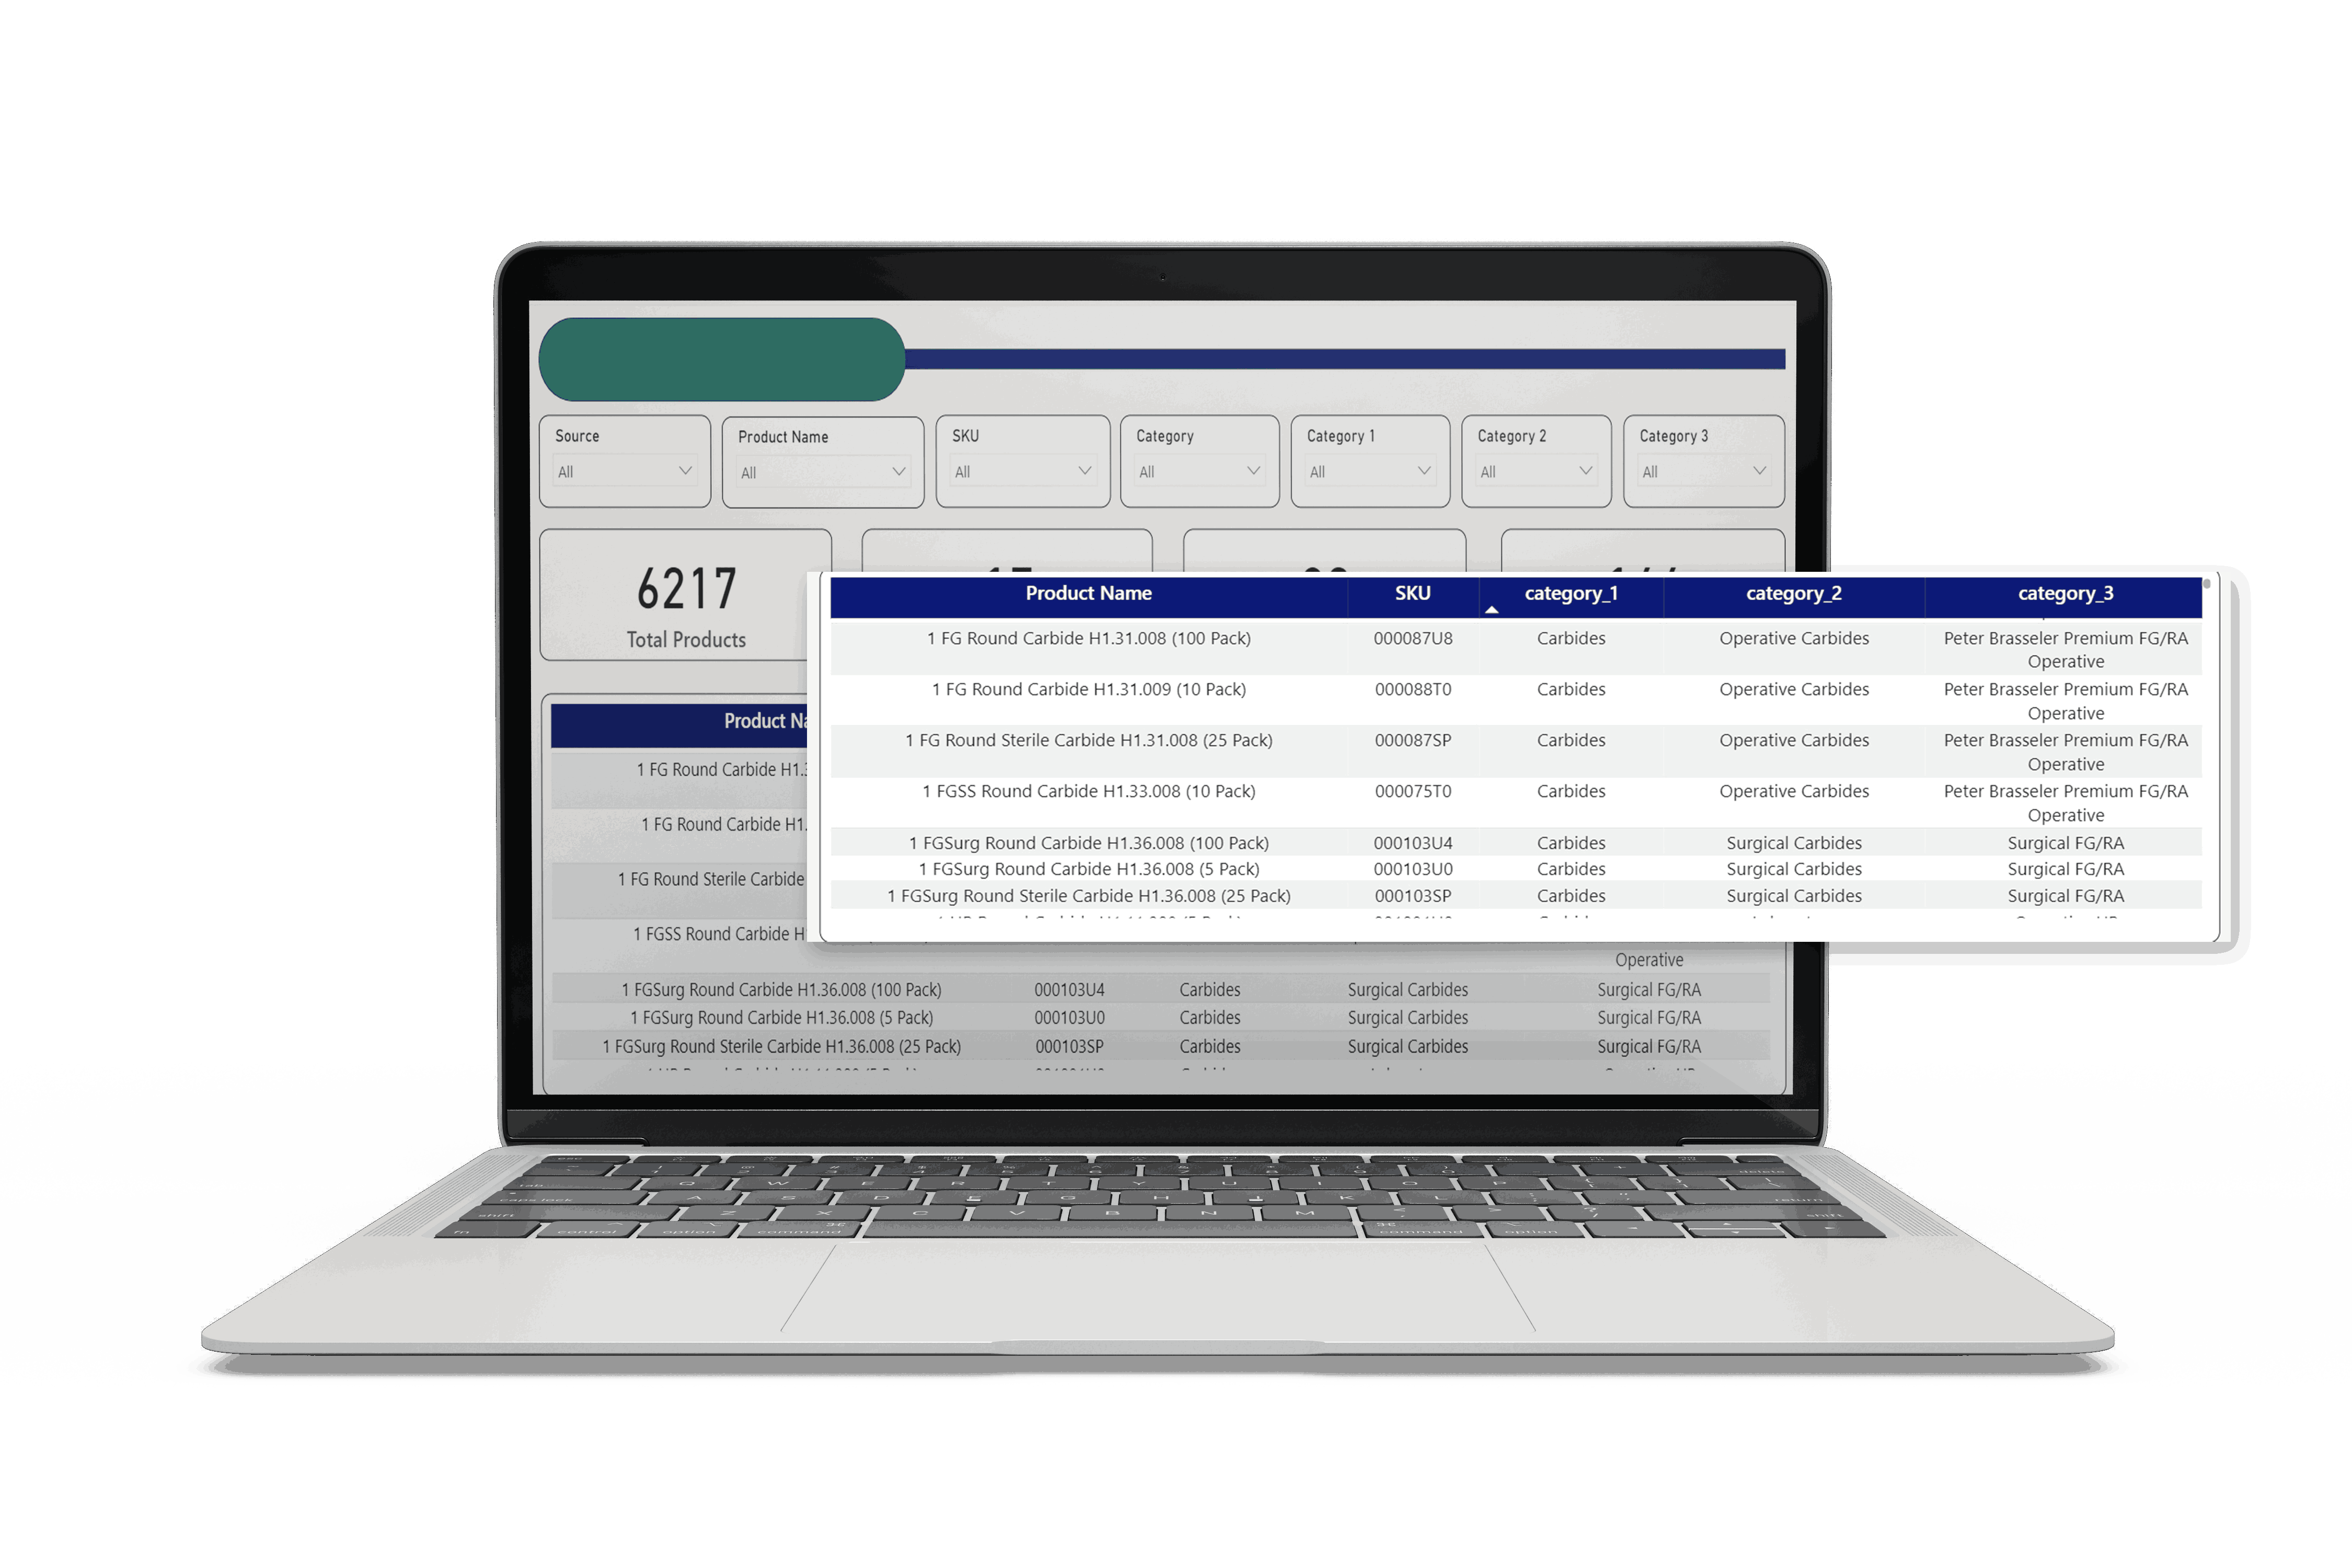
Harnessed the power of data-driven insights enabling the client to gain a comprehensive understanding of the market dynamics and competitor landscape. Our expertise in web scraping, data processing, and the development of a user-friendly PowerBI dashboard proved instrumental.
Delivering the best solutions starts with understanding the business needs. Our approach is tailored to meet your unique goals and objectives.
Power BI is an ideal choice for visualization due to its numerous advantages. It offers a user-friendly interface and a wide range of features to customize, allowing users to transform complex data into attractive visuals. Power BI seamlessly integrates various data sources, enabling the collection of data from multiple platforms. The platform supports real-time data streaming and collaboration, making it an effective tool for sharing and analyzing data across teams. Overall, Power BI’s versatility, ease of use, and robust features make it a powerful solution for effective data visualization.
To make the most of data visualization using Power BI, businesses can consider the following strategies;
In Power BI, you can add data to visualizations by following these steps;
Partner with us to design, build, and scale digital solutions that drive better outcomes.
Global Tech Teams LLC, 525 Washington Blvd, Industrious at Newport Tower, Jersey City, NJ 07310, United States.
Let’s discuss your goals, workflows, and next steps in a focused consultation call.


 BLOGS
BLOGS  NEWSROOM
  CASE STUDIES
  WEBINARS
  PODCASTS
  ASSET HUB
  EVENT CALENDAR