Nowadays, React comes with new particular capabilities and inspects the higher overall performance of our React Application. So in this blog, we will study React Profiler, The tool which helps us improve our application.
In cutting-edge days, the arena is going too speedy. Then why do our applications stay back? Why do our programs work slowly? Some elements make our software slower, and the main factor is “Re-Rendering.”
The React Profiler offers us data where we will discover which element takes how much time and also get statistics on how generally components get re-render.
There are methods available to do Profiling for our React software.
NOTE: Make sure that your react-dom version is above 16.5.
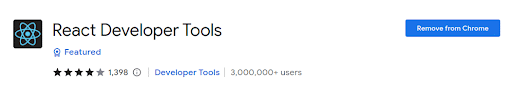
Nowadays, we can use the React DevTools Profiler to profile our React applications and improve their performance. So first, we want to put in React Developer equipment as an extension of Chrome. You may get a concept from the photo underneath.
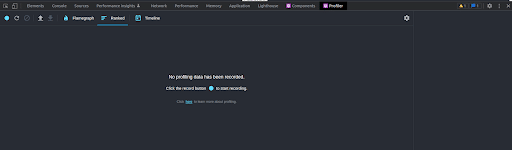
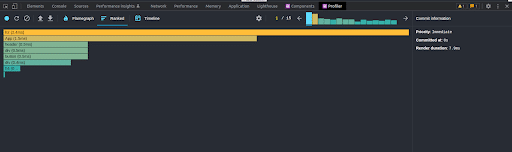
The Profiler Tab is empty, first of all. There are several alternatives to be had for show statistics in specific approaches and also with complete records. After beginning the React utility, we must open checkout mode in chrome and can get some options with a profiler. You may get a concept from the image below.
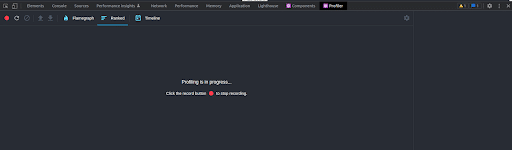
There may be two ways to begin recording. First, click on the blue button to start recording, and another way is to press the refresh button right after the blue button. As soon as you finish recording, you need to press the stop button, which is in red. You may get a concept from the underneath picture.
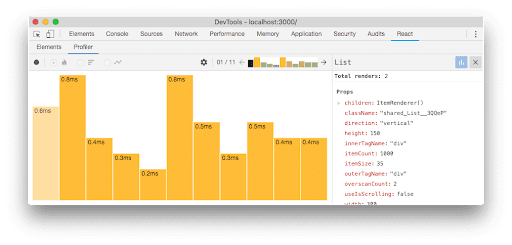
The React Profiler collects statistics inside the commit segment and groups the general performance info with the aid of a commit. The commits are displayed in a bar chart under the photograph.
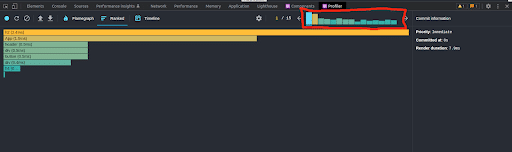
You can see that the Profiler collects every commit’s information and shows it like this. There may be a few exceptional meanings for each color. The colors suggest how lots time is taken via the specific factor.
Using this, we will get the concept of which factor takes lots of time to render, and with the usage of memoization, we can reduce the cost of unnecessary re-rendering and make our utility faster.
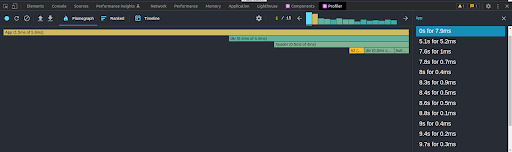
The longer your profile, the more time your utility spends and collects extra commits. The Profiler presents us with a way to filter the devotion via a selected time. You can get the idea from the below photo.
 Chart
ChartThe Profiler provides us with numerous charts of commits, and the list is under.
Let’s dive deep into these charts and understand them.
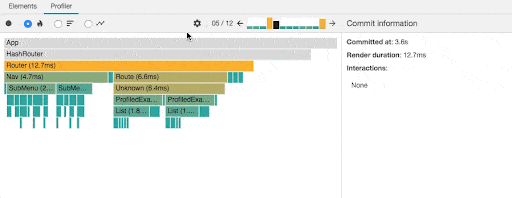
This view represents the state of your application for a single commit. In the picture, every bar represents a component, and the width represents the time taken to use the particular element.
By clicking on the bar, you may get the unique rendering facts for the thing and the duration of a particular rendering. You can see into the picture.
Within the profiler, you will get the Ranked Tab at the top. Press on it. It shows us a ranked chart, which is primarily based on how much time the component takes. So you’ll get all charts on the top, which brought greater time and on the down, you’ll get that factor which took much less time.
On this chart, additionally get all facts like time taken by using the component for render and how long it takes to render, and so on. For example, you can see the below photograph.
Double-clicking on a component will help you view the component chart. This view will provide statistics on the component lifecycle for the profiling time. The data is displayed in the form of a bar chart wherein every bar shows at what time the particular element became rendered, and the length of the bat suggests for a way lengthy it turned into rending.
No Profiling Data Has Been Recorded For The Selected Root:
In case your software has multiple roots then you will get this type of message after profiling.
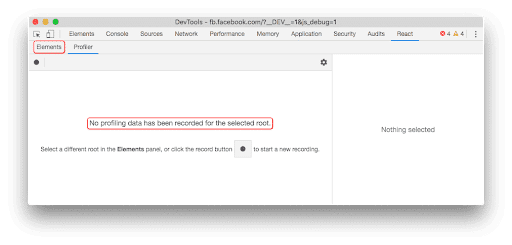
After completing profiling, no performance records became recorded or amassed for the selected root. Therefore, do once more profiling with distinct sources.

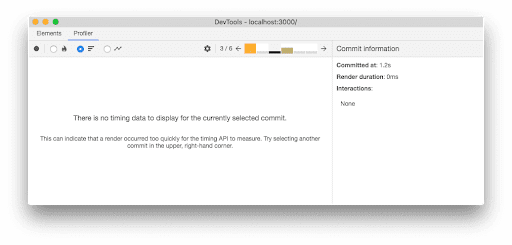
No Timing Data To Display For The Selected Commit
From time to time, a dedicate can be so speedy. That’s why DevTools don’t show any meaningful timing statistics. In this sort of case, you will get this form of message. See the below picture.

In conclusion, the React Profiler is a powerful tool that can help developers debug and optimize their React applications. By providing a detailed breakdown of the performance of individual components, the profiler allows developers to identify and fix performance bottlenecks and improve the overall efficiency of their applications.
Whether you are working on a small personal project or a large-scale enterprise application, the React Profiler can help you create faster, more responsive and user-friendly applications.

We worked with Mindbowser on a design sprint, and their team did an awesome job. They really helped us shape the look and feel of our web app and gave us a clean, thoughtful design that our build team could...

The team at Mindbowser was highly professional, patient, and collaborative throughout our engagement. They struck the right balance between offering guidance and taking direction, which made the development process smooth. Although our project wasn’t related to healthcare, we clearly benefited...

Founder, Texas Ranch Security
Mindbowser played a crucial role in helping us bring everything together into a unified, cohesive product. Their commitment to industry-standard coding practices made an enormous difference, allowing developers to seamlessly transition in and out of the project without any confusion....

CEO, MarketsAI
I'm thrilled to be partnering with Mindbowser on our journey with TravelRite. The collaboration has been exceptional, and I’m truly grateful for the dedication and expertise the team has brought to the development process. Their commitment to our mission is...
Founder & CEO, TravelRite
The Mindbowser team's professionalism consistently impressed me. Their commitment to quality shone through in every aspect of the project. They truly went the extra mile, ensuring they understood our needs perfectly and were always willing to invest the time to...

CTO, New Day Therapeutics
I collaborated with Mindbowser for several years on a complex SaaS platform project. They took over a partially completed project and successfully transformed it into a fully functional and robust platform. Throughout the entire process, the quality of their work...

President, E.B. Carlson
Mindbowser and team are professional, talented and very responsive. They got us through a challenging situation with our IOT product successfully. They will be our go to dev team going forward.

Founder, Cascada
Amazing team to work with. Very responsive and very skilled in both front and backend engineering. Looking forward to our next project together.
Co-Founder, Emerge
The team is great to work with. Very professional, on task, and efficient.

Founder, PeriopMD
I can not express enough how pleased we are with the whole team. From the first call and meeting, they took our vision and ran with it. Communication was easy and everyone was flexible to our schedule. I’m excited to...

Founder, Seeke
We had very close go live timeline and Mindbowser team got us live a month before.

CEO, BuyNow WorldWide
If you want a team of great developers, I recommend them for the next project.

Founder, Teach Reach
Mindbowser built both iOS and Android apps for Mindworks, that have stood the test of time. 5 years later they still function quite beautifully. Their team always met their objectives and I'm very happy with the end result. Thank you!

Founder, Mindworks
Mindbowser has delivered a much better quality product than our previous tech vendors. Our product is stable and passed Well Architected Framework Review from AWS.

CEO, PurpleAnt
I am happy to share that we got USD 10k in cloud credits courtesy of our friends at Mindbowser. Thank you Pravin and Ayush, this means a lot to us.

CTO, Shortlist
Mindbowser is one of the reasons that our app is successful. These guys have been a great team.

Founder & CEO, MangoMirror
Kudos for all your hard work and diligence on the Telehealth platform project. You made it possible.

CEO, ThriveHealth
Mindbowser helped us build an awesome iOS app to bring balance to people’s lives.

CEO, SMILINGMIND
They were a very responsive team! Extremely easy to communicate and work with!

Founder & CEO, TotTech
We’ve had very little-to-no hiccups at all—it’s been a really pleasurable experience.

Co-Founder, TEAM8s
Mindbowser was very helpful with explaining the development process and started quickly on the project.
Executive Director of Product Development, Innovation Lab
The greatest benefit we got from Mindbowser is the expertise. Their team has developed apps in all different industries with all types of social proofs.

Co-Founder, Vesica
Mindbowser is professional, efficient and thorough.
Consultant, XPRIZE
Very committed, they create beautiful apps and are very benevolent. They have brilliant Ideas.

Founder, S.T.A.R.S of Wellness
Mindbowser was great; they listened to us a lot and helped us hone in on the actual idea of the app. They had put together fantastic wireframes for us.

Co-Founder, Flat Earth
Ayush was responsive and paired me with the best team member possible, to complete my complex vision and project. Could not be happier.

Founder, Child Life On Call
The team from Mindbowser stayed on task, asked the right questions, and completed the required tasks in a timely fashion! Strong work team!
CEO, SDOH2Health LLC
Mindbowser was easy to work with and hit the ground running, immediately feeling like part of our team.

CEO, Stealth Startup
Mindbowser was an excellent partner in developing my fitness app. They were patient, attentive, & understood my business needs. The end product exceeded my expectations. Thrilled to share it globally.

Owner, Phalanx
Mindbowser's expertise in tech, process & mobile development made them our choice for our app. The team was dedicated to the process & delivered high-quality features on time. They also gave valuable industry advice. Highly recommend them for app development...

Co-Founder, Fox&Fork