BLOGS
BLOGS  NEWSROOM
  CASE STUDIES
  WEBINARS
  PODCASTS
  ASSET HUB
  EVENT CALENDAR


TL;DR:
Medicare pays between $43.76 and $144.29 per patient per month for Chronic Care Management (CCM) under the 2026 fee schedule, depending on code selection and practice setting. Advanced Primary Care Management (APCM) bundled codes range from $16.37 to $117.24 per patient per month, with new behavioral health add-ons introduced for 2026. CMS increased CCM reimbursement by 8-11% across all codes, the largest bump in five years.
Small clinics can achieve steady six-figure revenue, while mid-market hospitals have the potential to generate millions annually. The financial outcome depends on three main factors: enrollment percentage, distribution of service minutes, and denial rates. APCM continues to create new opportunities, but also changes the math for staffing and panel management.
Chronic Care Management (CCM) has steadily evolved from a pilot program into a recurring revenue stream for practices, health systems, and clinics serving Medicare beneficiaries. With nearly two-thirds of Medicare patients living with two or more chronic conditions, the demand for structured, reimbursable chronic care services continues to grow.
The 2026 Medicare Physician Fee Schedule (CMS-1832-F) brought three important changes. First, it increased reimbursement rates for all CCM and APCM codes by 8-11%, driven by the highest conversion factor increase in five years. Second, it added new behavioral health integration add-on codes under APCM (G0568, G0569, G0570), expanding reimbursement for practices managing patients with co-occurring mental health conditions. Third, the transition from the flat G0511 code for Rural Health Clinics and FQHCs is now complete — these facilities now bill using the same CPT-based structure as other providers.
This shift has direct financial implications. Practices now need to understand which codes to bill, how much each code pays annually, and whether CCM or APCM is the better fit for their patient panels. The following sections provide a detailed breakdown of reimbursement amounts, scenario-based revenue projections, and the sensitivities that affect bottom-line results.
Patients × payment per month = your CCM revenue. So what’s yours?
Medicare increased CCM payments, but many practices still underperform against their own patient base. The issue isn’t patient volume.
It’s execution across enrollment, time capture, and documentation. Even small gaps in those areas can quietly drain six figures from your program.
Enrollment, minutes, and denials shape the outcome more than most expect. This guide breaks down how the math turns into real dollars and where that revenue is often lost.
I. Who Qualifies for CCM: Population Size and Eligibility Criteria
Before you can model revenue, you need to know how many patients in your panel actually qualify. The eligible population is much larger than most practices realize, and the patient identification rule is simpler than the documentation rule that comes after it.
A. How Big is the Eligible CCM Population?
- 66 million Medicare beneficiaries currently enrolled (CMS, 2025 data, latest available)
- Roughly two-thirds, about 44 million, have two or more chronic conditions and meet the basic CCM eligibility threshold
- Of practices currently offering CCM, the median enrollment rate is 24% of eligible patients (industry benchmark from Medicare claims analysis)
- Top-quartile practices – the ones with structured outreach and EHR-embedded enrollment – clear 45–55% enrollment
The gap between median and top-quartile enrollment is roughly 2x revenue per Medicare panel for the same fee schedule.
B. Who Qualifies (The Four-Part Rule)
A patient is eligible for CCM if all four of the following are true:
- Medicare Part B coverage (traditional Medicare or Medicare Advantage with CCM coverage in the plan)
- Two or more chronic conditions expected to last at least 12 months or until death of the patient
- The conditions place the patient at significant risk of death, acute exacerbation, decompensation, or functional decline
- The patient consents to CCM services (verbal consent is allowed under current rules; written or EHR-recorded preferred for audit defense)
The list of qualifying chronic conditions is broad – over 60 conditions count, including but not limited to: diabetes, hypertension, heart failure, COPD, asthma, depression, anxiety, dementia, arthritis, chronic kidney disease, cancer in active treatment or surveillance, and substance use disorder.
C. How to Identify Qualifying Patients in Your Panel
The fastest path is an EHR query against ICD-10 chronic condition codes. Most modern EHRs (Epic, Cerner, Athena, Canvas) support this natively. The query returns the eligible list; the harder problem is enrollment – convincing patients to consent and stay engaged month after month.
Practices that automate patient identification – flagging eligible patients automatically at the point of an annual wellness visit or any office visit – convert 35–45% of identified patients to enrolled within 90 days. Practices relying on manual chart review convert 10–15%.
D. One Thing the Rate Schedule Doesn’t Tell You
The patient cost-share matters more than most practices admit. CCM is subject to the standard Part B 20% coinsurance – about $13/month at 2026 rates – unless the patient has supplemental coverage, Medicaid, or QMB. In panels with high dual-eligible or supplemental coverage rates, the cost-share is invisible to the patient and enrollment runs 40–55%. In panels with high traditional-Medicare-only coverage, the cost-share becomes a hesitation point and enrollment runs 15–25%. Plan accordingly when modeling revenue.
– CMS Medicare Enrollment Dashboard (2025 latest). Last verified: 2026-05-02.
– CMS National Health Expenditure Data – Medicare beneficiaries with chronic conditions. Last verified: 2026-05-02.
II. The 2026 Medicare Fee Schedule
A. Three-Year Rate Comparison: 2024 vs 2025 vs 2026
CMS raised CCM and APCM reimbursement rates by 8–11% in 2026 – the largest single-year increase since these programs were introduced. The three-year trend matters because it tells practices whether the increase is a temporary correction or the beginning of a longer reimbursement expansion cycle.
The data points clearly toward the second scenario.
| Code | Description | 2024 (Non-Facility) | 2025 (Non-Facility) | 2026 (Non-Facility) | 2024 → 2026 Change |
|---|---|---|---|---|---|
| 99490 | Standard CCM (20 min) | $61.27 | $60.49 | $66.13 | +7.9% |
| 99439 | Standard Add-on (+20 min) | $46.80 | $45.93 | $50.44 | +7.8% |
| 99491 | Physician CCM (30 min) | $83.57 | $82.16 | $89.18 | +6.7% |
| 99437 | Physician Add-on (+30 min) | $58.18 | $57.31 | $63.13 | +8.5% |
| 99487 | Complex CCM (60 min) | $132.92 | $131.65 | $144.29 | +8.6% |
| 99489 | Complex Add-on (+30 min) | $71.04 | $70.52 | $78.16 | +10.0% |
| G0556 | APCM Basic | – | $15.20 | $16.37 | +7.7% (vs 2025) |
| G0557 | APCM Expanded | – | $48.84 | $53.78 | +10.1% (vs 2025) |
| G0558 | APCM Advanced | – | $107.07 | $117.24 | +9.5% (vs 2025) |
Two takeaways:
- The 2024→2025 dip was the conversion factor cut that everyone complained about. 2026 doesn’t just recover – it lands meaningfully above 2024 for every CCM code. Practices that paused CCM expansion in 2025 should revisit their model.
- APCM codes (introduced in 2025) had their first rate review in 2026 and got a 7-10% bump out of the gate. CMS is signaling APCM is here to stay and will be tuned annually, not left to drift.
– CMS 2024 Physician Fee Schedule Final Rule (CMS-1784-F). Last verified: 2026-05-02.
– CMS 2025 Physician Fee Schedule Final Rule (CMS-1807-F). Last verified: 2026-05-02.
B. Standard CCM and Complex CCM Codes
Medicare’s CCM program continues to reward providers for structured, non-face-to-face care coordination. Payment amounts vary depending on time spent and complexity of care.
- 99490 – Non-complex CCM (20 minutes)
$66.13 in non-facility settings
$43.76 in facility settings
Annualized: $794 to $525 per patient - 99439 – Add-on for each additional 20 minutes
$50.44 non-facility
$30.73 facility
Annualized: $605 to $369 per patient - 99487 – Complex CCM (60 minutes)
$144.29 non-facility
$79.16 facility
Annualized: $1,731 to $950 per patient - 99489 – Add-on for each additional 30 minutes
$78.16 non-facility
$43.76 facility
Annualized: $938 to $525 per patient
Each code has specific documentation requirements. From our builds, the most common denial triggers are missing time logs or incomplete care plan updates. Embedding time-tracking directly into EHR tasking eliminates the need for manual reconciliation.
C. Physician and Qualified Health Professional Codes
Some providers prefer codes that specifically account for the time of physicians or advanced practice providers. These codes recognize higher levels of professional involvement.
- 99491 – 30 minutes of physician or qualified health professional time
$89.18 non-facility
$65.47 facility
Annualized: $1,070 per patient (non-facility) - 99437 – Add-on for each additional 30 minutes
$63.13 non-facility
$43.76 facility
Annualized: $758 per patient (non-facility)
Full Rate Table For All CCM + APCM Codes, Formatted For Print
D. APCM Bundled Codes (Introduced in 2025)
The Advanced Primary Care Management codes, introduced in 2025, represent a significant change in approach. Instead of requiring time tracking, they stratify payment by patient complexity. For 2026, CMS increased APCM rates by 7-10% and added new behavioral health integration add-ons.
- G0556 – Basic bundle for patients with zero or one chronic condition
$16.37 per month
$196 annualized - G0557 – Expanded bundle for patients with two or more conditions
$53.78 per month
$645 annualized - G0558 – Advanced bundle for patients with social complexity in addition to chronic conditions
$117.24 per month
$1,407 annualized
APCM Behavioral Health Add-Ons:
CMS added three add-on G-codes for practices managing patients with co-occurring behavioral health conditions under APCM. These do not require minute-based documentation.
- G0568 — Initial Collaborative Care Management (similar to 99492)
Approximately $162 per month - G0569 — Subsequent Collaborative Care Management (similar to 99493)
Approximately $146 per month - G0570 — General Behavioral Health Integration (similar to 99484)
Approximately $58 per month
These add-ons expand APCM reimbursement for practices serving patients with depression, anxiety, substance use disorders, and other behavioral health conditions alongside chronic medical conditions.
E. RHC and FQHC Transition Away from G0511
Rural Health Clinics and Federally Qualified Health Centers previously relied on the G0511 code, which provided a flat payment for care management. CMS phased out G0511 with a transition period that ended September 30, 2025.
RHCs and FQHCs now bill using the standard CPT-based methodology, which aligns reimbursement with patient complexity rather than a flat rate. This parity means community-based providers can now capture higher reimbursement for complex patients using codes like 99487 or APCM G0558.
Facilities that have not yet updated their billing workflows should do so immediately to avoid leaving revenue uncaptured.
The scenarios above are based on 600 and 12,000 lives. Most practices fall somewhere in between. Use the calculator below to model your specific practice – adjust your panel size, enrollment rate, code mix, and denial rate to see projected annual revenue, net margin, and break-even point.
CCM Revenue Calculator
CCM vs APCM • Program Grading • Break-Even Analysis
Determine Eligible Patients
Patients must have two or more chronic conditions to qualify for CCM.
Patient Participation Rate
Percentage of eligible patients enrolled and active in your CCM program.
PROGRAM DISTRIBUTION
Monthly & Annual Revenue
Based on enrolled patients, volume, and per-code reimbursement.
Operations & Staffing
Staffing inputs to calculate net margin.
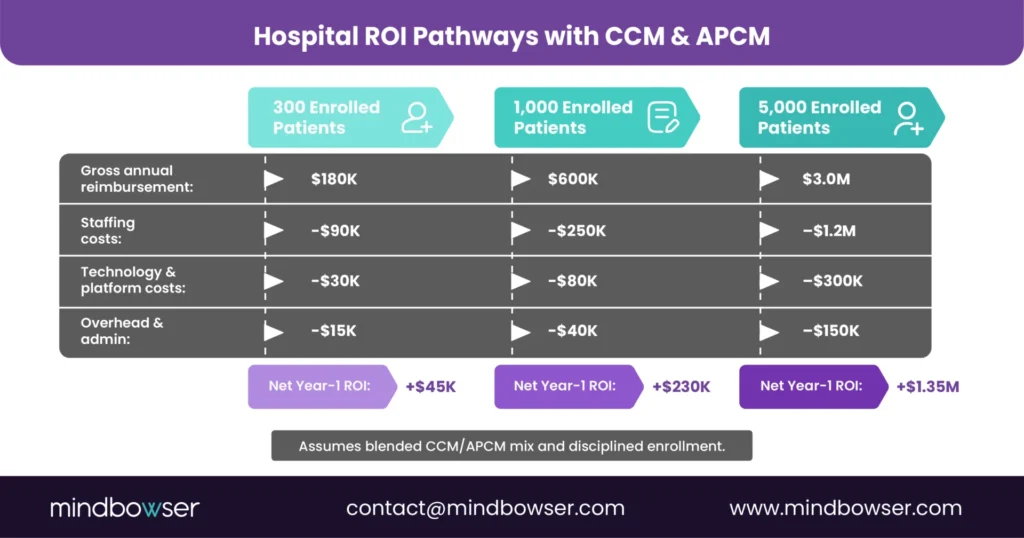
III. Scenarios – Small Clinic vs Mid-Market Hospital
Medicare’s fee schedule provides the raw numbers, but revenue potential depends on how those codes are applied across real-world practice settings.
Two scenarios illustrate how payment levels translate into annualized income: a small independent clinic and a mid-market hospital. All calculations use 2026 non-facility rates.
A. Scenario 1: Small Clinic with 600 Medicare Lives
- Panel size and enrollment assumptions
- The clinic employs three primary care physicians who together manage about 600 Medicare beneficiaries. On average, only a portion of the panel will enroll in CCM services.
- For modeling, a 30% enrollment rate is assumed, which equals 180 patients.
- Code utilization mix
- About 70% of these patients receive standard CCM under code 99490.
- 20% fall into the complex CCM category under code 99487, given multiple comorbidities and higher care coordination needs.
- The remaining 10% qualify for APCM G0557, which provides bundled reimbursement for patients with two or more conditions.
- Revenue outcomes
- Standard CCM: 126 patients at $794 per year yields approximately $100,000.
- Complex CCM: 36 patients at $1,731 per year yields approximately $62,300.
- APCM: 18 patients at $645 per year yields approximately $11,600.
- Total estimated annual revenue: $174,000 to $230,000, depending on add-on capture.
- With consistent add-on billing (99439 at $50.44 for standard patients, 99489 at $78.16 for complex patients), the same clinic can push annual revenue above $228,000 before denials.
- Operational implications
- With a patient pool of this size, the clinic can justify one full-time care coordinator.
- The 2026 rate increases mean each enrolled patient generates 8-11% more revenue than in 2025, improving the economics of that hire.
- Reliable documentation systems remain essential to minimize denial risk.
As shown in the scenarios, mid-market hospitals stand to benefit from APCM in 2026 by creating predictable revenue streams based on patient complexity and streamlining their workflows with the right automation.
B. Scenario 2: Mid-Market Hospital with 12,000 Medicare Lives
- Panel size and enrollment assumptions
- A mid-market hospital with a large employed physician group serves approximately 12,000 Medicare beneficiaries.
- Using a more aggressive 40% enrollment rate, the program would reach 4,800 patients.
- Code utilization mix
- Half of the patients are managed under standard CCM codes.
- 30% meet the criteria for complex CCM, reflecting higher-acuity patient populations often seen in hospital-affiliated groups.
- 20% are aligned under APCM G0558, which captures patients with both multiple conditions and social complexity.
- Revenue outcomes
- Standard CCM: 2,400 patients at approximately $794 per year yields $1.91 million.
- Complex CCM: 1,440 patients at approximately $1,731 per year yields $2.49 million.
- APCM: 960 patients at $1,407 per year yields $1.35 million.
- Total estimated annual revenue: $5.75 million to $8.5 million depending on add-on capture and denial rates.
- Operational implications
- This scale requires a dedicated CCM department or an outsourced partner.
- Automation becomes essential. Workflows like CarePlan AI and AI Medical Summary can generate structured care plans and progress notes, reducing manual staff effort.
- Hospitals at this size often face higher denial exposure, making audit-ready artifacts and EHR integration critical for sustainable margins.
- The OIG added CCM to its 2026 Work Plan, with enforcement expected through FY 2028. Hospitals running large panels should ensure their documentation meets audit requirements for eligibility verification and time tracking.
C. Key Takeaways Across Both Scenarios
- Revenue potential is a function of enrollment. Even a 10% change in participation rates significantly alters financial results.
- Complexity drives reimbursement. Hospitals that manage higher-acuity and socially complex patients can generate more revenue by capturing APCM payments or billing complex CCM codes.
- The 2026 rate increase changes the math. CCM codes pay 8-11% more than in 2025, and APCM codes increased 7-10% for a mid-market hospital, which translates to $400,000-$700,000 in additional annual revenue at the same enrollment levels.
- Operations determine sustainability. Small clinics need efficiency and reliable documentation, while hospitals require automation and scaling strategies.
IV. Sensitivities – What Moves the Needle
Revenue from Chronic Care Management does not depend only on published fee schedules. The actual dollars collected hinge on operational choices, patient engagement, and compliance practices.
Three factors consistently determine whether CCM is a steady but modest income stream or a significant driver of organizational revenue: enrollment percentage, distribution of minutes, and denial rates.
A. Enrollment Percentage
- Baseline participation
Most practices find that 20 to 30% of eligible Medicare patients will agree to participate when CCM is first offered. Consent requirements, patient cost-sharing, and awareness are the main hurdles at this stage. - Impact of higher uptake
Suppose a practice moves from 20% to 40% enrollment — revenue more than doubles without adding new patients. For example, a 600-patient clinic at 20% enrollment earns roughly $115,000 annually at 2026 rates, while the same clinic at 40% enrollment approaches $230,000. - Levers to improve adoption
- Proactive education at the point of care.
- Consistent follow-up and scripting from care coordinators to reduce confusion and boost acceptance.
- Algorithmic patient identification within the EHR to flag eligible patients automatically.
B. Distribution of Minutes
- The role of add-on codes
Revenue rises significantly when staff consistently document enough non-face-to-face time to qualify for add-on codes such as 99439 or 99489. At 2026 rates, these codes add $50.44 or $78.16 per patient per month, respectively. Annualized, that’s $605 to $938 per patient — a 76-54% revenue increase over the base code alone. - Staffing implications
Capturing additional minutes requires deliberate workflows. Care coordinators must schedule outreach calls, log time accurately, and close care plan gaps to ensure effective care coordination. Without structure, add-on billing becomes sporadic, and revenue is left on the table. - Balancing staff time
Hospitals can deploy AI-enabled workflows, such as CarePlan AI or HealthCheck AI, to streamline repetitive documentation, thereby freeing staff to spend more time with patients. This ensures add-on thresholds are met without expanding headcount.
C. Denial Rates
- Common reasons for denials
- Missing or incomplete patient consent.
- Care plans that lack measurable goals or are not updated regularly.
- Inaccurate or missing time logs.
- OIG 2026 enforcement context
The Office of Inspector General added CCM to its 2026 Work Plan, announced March 2026. The focus areas are eligibility documentation (confirming patients meet the two-or-more chronic conditions requirement) and the “multiple chronic conditions” threshold. Enforcement is expected to run through FY 2028. Practices with weak documentation are at higher risk of recoupment. - Financial impact
A denial rate of 5% on a large panel can result in hundreds of thousands of dollars in potential reimbursement being erased. At 10%, denial losses may consume the entire margin for a small clinic. At 2026 rates, each 1% of denial on a $5 million CCM program costs $50,000. - Mitigation strategies
- Embedding audit-ready artifacts directly into the EHR, including FHIR CarePlan, Task, and ServiceRequest objects.
- Automating consent collection with patient questionnaires that feed structured data into records.
- Conducting quarterly internal audits to identify gaps before payers do.
- Ensuring time-tracking systems capture start/stop times, activity descriptions, and staff attribution for every encounter.
D. Combined Effect of Sensitivities
When viewed together, enrollment, minutes, and denials create wide swings in financial outcomes. A mid-market hospital with 12,000 Medicare patients could generate $5.75 to $8.5 million annually under average assumptions. If enrollment improves to 50%, add-on minutes are consistently captured, and denials are held below 3%, the same hospital could approach $11 million in net reimbursement at 2026 rates. Conversely, low enrollment and high denial rates can reduce revenue by nearly half.
V. Staffing the Program — Patients per Coordinator, Touchpoints, and Workflow Reality
Most CCM economics articles stop at “you need a care coordinator.” The harder questions — how many patients can one coordinator actually manage, how many monthly touchpoints does each patient need, what does the day actually look like — get skipped because the answers vary by setup. Below is what I see across practices we work with.
A. Patients Per Coordinator (The Actual Range)
| Workflow Setup | Realistic Caseload per Coordinator | Monthly Touchpoints per Patient |
|---|---|---|
| Manual (paper care plans, spreadsheet time logs) | 200–250 patients | 1–2 touchpoints, often partial |
| EHR-embedded but manual time tracking | 275–325 patients | 2 consistent touchpoints |
| Workflow-automated (auto-generated care plans, embedded timestamps) | 350–450 patients | 2–3 touchpoints, fully documented |
The variance is not about coordinator quality — it’s about how much of the day gets eaten by documentation tax. In a manual setup, a coordinator spends 60–70% of the workday on documentation, scheduling, and reconciliation. In a workflow-automated setup, the same coordinator spends 30–40% on those tasks and the rest on actual patient care.
B. What Changes When Documentation is Automated
On one clinical AI platform build, the documentation burden was the explicit problem to solve. The result: care coordinators spent 70% less time on documentation and 60% less time on post-visit follow-up, which translated directly into either larger panels per coordinator or shorter days for the same panel — practice’s choice.
The same principle applies whether you build custom or adopt a platform like CarePlan AI or pieces of the HealthConnect CoPilot accelerator. The lever is the same: pull documentation off the coordinator’s plate by generating it from the structured data already in the EHR, instead of asking the coordinator to type it twice.
C. A Realistic Month for a CCM Coordinator (Manual vs Automated)
In a manual program, a coordinator managing 220 patients spends roughly:
- 8 hours/week scheduling patient outreach calls
- 12 hours/week on calls and documentation
- 6 hours/week on care plan updates and signature collection
- 4 hours/week on billing reconciliation
- 5 hours/week on internal meetings, EHR catchup, and the rest
- Total: 35 hours/week spent — and panel still drops 1–2 add-on codes per patient per month
In a workflow-automated program, the same coordinator managing 380 patients spends roughly:
- 4 hours/week on outreach (auto-scheduled, manual exceptions only)
- 16 hours/week on calls and patient engagement
- 2 hours/week on care plan updates (auto-generated, edit-and-approve)
- 1 hour/week on billing (auto-reconciled, exceptions only)
- 5 hours/week on internal meetings and EHR catchup
- Total: 28 hours/week spent — and panel reliably hits add-on threshold
The math: same coordinator, 73% more patients managed, 7 fewer hours of work, full add-on capture. That’s not a tooling claim — that’s the documentation tax going from 60% of the day to 30%.
D. What Stays Human, No Matter the Workflow
A few things don’t automate and shouldn’t. SDOH screening conversations, end-of-life planning, culturally calibrated communication for non-English-primary patients, clinical escalation decisions when a patient’s vitals trend wrong — these stay with the coordinator and the clinician. Any program that automates these is taking a credibility risk, both with patients and with auditors.
Naming what stays human is part of the staffing model. Practices that pretend everything automates end up with care plans that look generated and patients who feel processed.
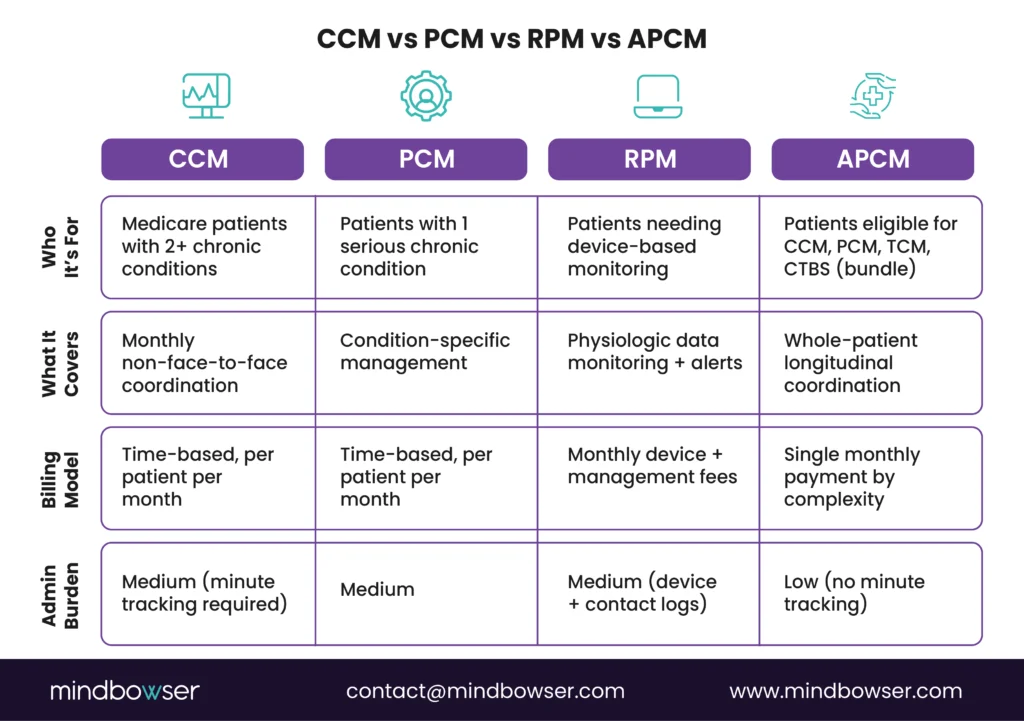
VI. CCM vs APCM — Which One Should You Bill?
The wrong way to answer this question is to compare published rates side-by-side and pick the higher number. The right way is to start with documentation capacity, because that’s the variable that actually decides which path makes more money for your practice.
Here’s the rule — and then the math underneath it.
A. The Decision Rule
| Your Documentation Capture Rate | What to Bill | Why |
|---|---|---|
| 80%+ of eligible minutes captured | Stay on CCM (99490 + 99439 + 99487/99489 where applicable) | You’re earning the add-on revenue APCM can’t match. The CCM ceiling is $2,669/patient/year (complex + add-on). The APCM ceiling is $1,407/patient/year (G0558). |
| 50–80% capture | Run the math both ways for your specific panel | This is the “it depends” band. Tilt APCM if patients have high social complexity (G0558 eligibility) or behavioral health comorbidity (G0568–G0570). Tilt CCM if you’re investing in documentation automation in the next 6 months. |
| Below 50% capture | Switch to APCM | You’re leaving money on the table with CCM while also absorbing audit risk. APCM removes minute-tracking requirements, so revenue stabilizes immediately while workflows improve. |
B. Three Signals You’re Below 50% Capture
If two or more of these are true, your practice is almost certainly under the threshold:
- Care coordinators track minutes in spreadsheets or on paper instead of inside the EHR
- Monthly billing requires manual reconciliation between care plan notes and the claims system
- You’ve had a 99490 claim denied in the last 12 months for documentation insufficiency
C. Two Cases Where APCM Wins Regardless of Capture Rate
1. Your Patient Population Has High Social Complexity
If your panel skews dual-eligible or carries heavy SDOH burden, G0558 at $117.24/month plus the new behavioral health add-ons (G0568, G0569, G0570) can outperform standard CCM reimbursement for the same patient.
APCM was built for this exact population profile.
2. Operational Capacity Is Already Maxed Out
RHCs, FQHCs, and smaller physician groups often benefit from APCM’s predictable monthly reimbursement because it removes the operational drag of minute tracking.
If your coordinators are already overloaded, APCM effectively buys back administrative capacity — even when the per-patient reimbursement is slightly lower.
D. The Hybrid Strategy Most Practices Miss
You cannot bill APCM and CCM for the same patient in the same calendar month.
But you can split the panel.
- High-complexity, high-social-risk patients → APCM (G0557/G0558)
- Stable chronic-condition patients with reliable engagement → CCM (99490 + 99439)
Practices running this hybrid model routinely generate 15–20% more Medicare panel revenue than single-track programs because they align reimbursement strategy to patient complexity instead of forcing one billing framework across the entire panel.
E. One Honest Caveat
The 80% and 50% thresholds above are operational benchmarks — not CMS rules.
They reflect what high-performing CCM programs consistently achieve versus what struggling programs typically capture. Your actual breakeven point depends on:
- Payer mix
- Panel composition
- Behavioral health prevalence
- SDOH burden
- APCM tier eligibility
- Existing documentation workflows
Run the math for your specific population before making a billing transition.
VII. Does CCM Actually Pay? The Cost vs Revenue Math Most Practices Get Wrong
The hesitation I hear most often from practice CFOs and revenue cycle leads goes like this: “$66 a month per patient — by the time I pay a coordinator, that’s a wash.” It’s a fair assumption from the outside. It’s also wrong by a margin most practices don’t realize until they see the numbers laid out.
The reason CCM looks unprofitable on a napkin is that the napkin is missing two variables: realistic patient panels and actual capture rate. Once you account for both, the question shifts from “does CCM pay” to “how much revenue is my current capture rate leaving on the table.” For most practices I’ve worked with, the answer is six figures.
A. What a CCM Coordinator Actually Costs
A loaded CCM care coordinator — RN or experienced medical assistant — runs $72,000 to $92,000 a year in most US markets, including base salary, a 28% benefits load, and a small allocation for supervisor time and EHR seat licenses. Rural practices land closer to the low end. Coastal metros land at the top.
Caseload is the lever that decides whether the role pays for itself. In manual workflows — paper care plans, spreadsheet time-tracking, no EHR-embedded prompts — a coordinator manages 200 to 250 patients comfortably. With workflow automation, the same coordinator manages 350 to 450 patients. That’s the same person, same hours, same patient quality, just without the documentation tax that eats their day.
B. What CCM Actually Pays Per Patient (2026 rates)
At non-facility rates under the 2026 fee schedule, annual revenue per enrolled patient looks like this:
| Billing Pattern | Monthly Revenue | Annual Revenue per Patient |
| Standard CCM only (99490) | $66.13 | $793.56 |
| Standard + 1 Add-on Period (99490 + 99439) | $116.57 | $1,398.84 |
| Complex CCM + 1 Add-on (99487 + 99489) | $222.45 | $2,669.40 |
The realistic billing pattern for a well-run program is the second row — 99490 plus a single 99439 add-on for the patients who need a second 20-minute touchpoint. The math below uses that pattern with an 80% capture rate, which is what disciplined programs achieve. Practices without documentation systems average 40 to 55% capture, and that gap — not the rate schedule — is the actual reason most CCM programs underperform.
C. The Math at Three Practice Sizes
| Practice Size | Enrolled CCM Patients | Coordinators (FTE) | Annual Coordinator Cost | Annual CCM Revenue (80% Capture, 99490 + 99439) | Net Margin | ROI |
|---|---|---|---|---|---|---|
| Small Primary Care (1–3 Physicians) | 150 | 0.6 FTE | $48,000 | $167,860 | $119,860 | 250% |
| Mid-Size Practice (4–10 Physicians) | 600 | 2.5 FTE | $200,000 | $671,443 | $471,443 | 236% |
| Health System or FQHC (Workflow-Automated) | 2,500 | 7 FTE | $560,000 | $2,797,680 | $2,237,680 | 399% |
Three things to notice:
The small practice clears six figures of net margin off a single part-time coordinator. That margin is usually enough to fund a quality manager, a patient outreach role, or the EHR upgrade the practice has been deferring.
Mid-size practices generate the largest absolute dollars but show slightly lower percentage ROI — that’s the cost of running a real CCM team rather than a side workflow. The dollars more than justify it.
The health system band crosses 399% ROI only because the workflow is automated. Without automation, the same panel needs 10 to 12 coordinators and the math compresses to roughly the mid-size band on a percentage basis.
The single biggest lever: capture rate
Two practices can have identical Medicare panels and identical staffing and still see CCM revenue differ by 2x. The variable is documentation discipline — minutes captured, care plans signed, and monthly notes attached to claims. On one custom platform build for a maternal-health program, embedding billing logic directly into the clinical workflow cut coding denials by 76%; tools like CarePlan AI do the same job for CCM specifically — auto-generating CMS-compliant care plans and pulling timestamps from the actual point of care, so capture rate climbs from 50% to 80%+ without adding staff.
That’s the difference between “CCM is breakeven” and “CCM funds three new hires.”
Get Expert Guidance on the APCM Transition
VIII. Proven Impact of Chronic Care Management
Real-world programs show that Chronic Care Management is not only a billing mechanism but also a proven driver of patient engagement, clinical outcomes, and operational efficiency. The following examples demonstrate the measurable impacts of implementing CCM platforms and workflows effectively.
A. Engagement and Adherence Gains
One health technology company serving elderly patients deployed a remote monitoring platform that integrated Bluetooth-enabled blood pressure cuffs and heart rate monitors. Patients were guided with daily task reminders and had access to secure video consultations with care managers.
- 90% of enrolled patients are actively engaged with the platform each month.
- Administrators reported that report generation was twice as fast compared with prior manual systems.
- The streamlined approach allowed a small care team to manage a larger panel without increasing staffing costs.
B. Documentation Capture Gains in Care Coordination
On a care-coordination platform we built, workflow automation cut post-visit follow-up time by 60% and documentation time by 70%. On a separate maternal-health build, embedding billing logic at the point of care cut coding denials by 76%. Those capture gains convert directly into reimbursable minutes that would otherwise be lost.
- 52% reduction in readmissions across targeted populations.
- Over 250,000 inpatient days were avoided in the first year of implementation.
- Medicaid plan costs declined by 12.1% due to fewer crises and emergency admissions.
C. Provider Efficiency Through AI and Data Integration
A chronic care platform integrated wearable devices, EHR data, and laboratory reports into a single patient dashboard. The system also applied AI tools to summarize blood reports and predict disease risks.
- 45% increase in patient interactions, with more patients consistently checking their data and following up.
- AI models achieved 90% prediction accuracy for chronic risk identification.
- Physicians reported 60% less review time per patient, freeing up hours weekly for direct care.
D. Impact of Addressing Social Determinants of Health
A platform that incorporated socioeconomic surveys and environment-related data into care planning demonstrated significant reductions in unnecessary utilization. Clinicians received a consolidated view that combined demographic, survey, and vital sign data.
- 67% reduction in emergency department visits among participating patients.
- Patients received more timely interventions for transportation, housing, and medication affordability issues.
- Practitioners noted that social data improved the accuracy of care plans and follow-up strategies.
E. Lessons Across Case Studies
- Engagement drives ROI. High levels of patient participation increase the likelihood of billing add-ons, which in turn support stronger reimbursement outcomes.
- Integration is essential. Platforms that connect devices, EHR data, and patient-reported information reduce staff burden and denial risks.
- Addressing non-clinical barriers matters. SDOH-informed care planning not only improves outcomes but also makes programs more sustainable under APCM.
- Efficiency creates scalability. Reducing administrative tasks by 50% or more enables practices to expand their patient panels without proportional increases in staff.
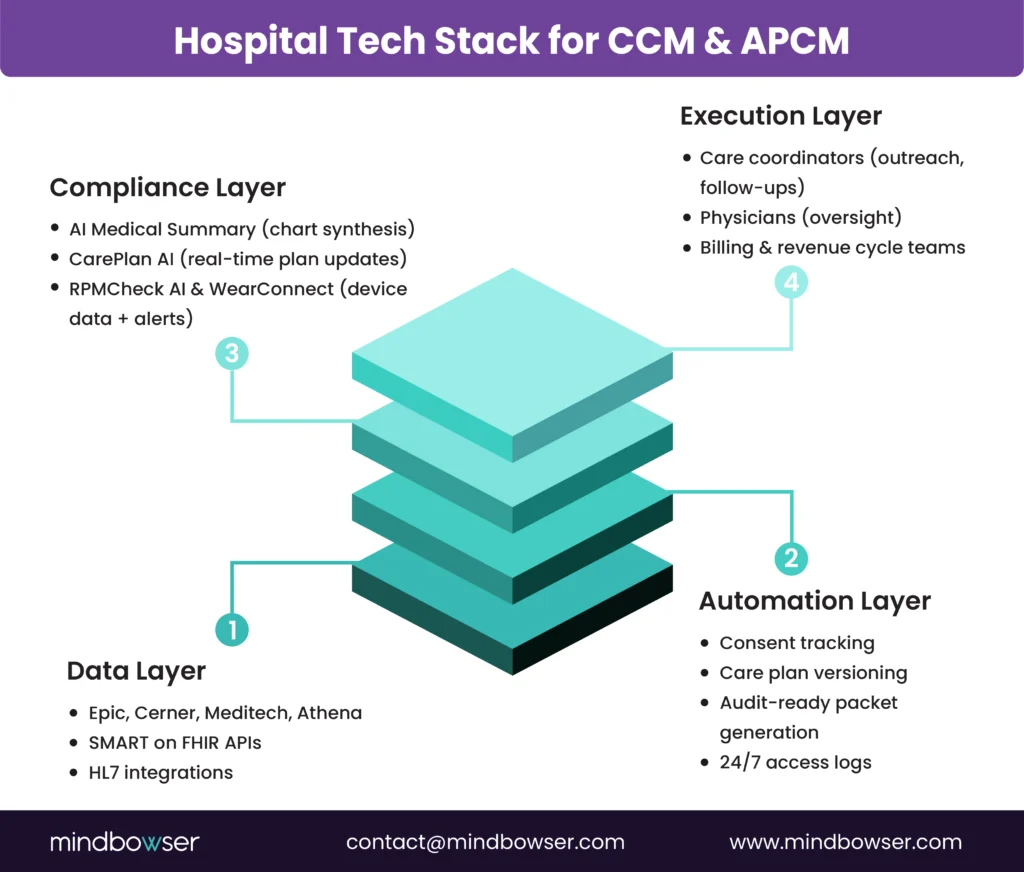
IX. Workflow Tie-Ins
While fee schedules define the upper limit of Medicare reimbursement, the real challenge is capturing the full value without overwhelming staff. Purpose-built technology accelerators can close this gap by automating documentation, enhancing patient communication, and ensuring compliance. These tools directly impact enrollment, time capture, and denial rates, which are the three levers that determine financial performance.
A. CarePlan AI – Automating Care Planning
- How it works
CarePlan AI simplifies the creation and updating of care plans by collecting patient goals and preferences through chat or voice interfaces. These inputs are automatically structured into templates that meet CMS requirements. - Financial impact
- Studies of CarePlan AI show a 37% higher patient understanding of their care plan.
- Coordination delays are reduced by 42% ensuring timely updates and fewer compliance risks.
- For clinics, this automation enables care coordinators to spend less time formatting documents and more time engaging with patients, resulting in consistent billing of core CCM codes.
B. AI Medical Summary – Structured History at Scale
- How it works
AI Medical Summary consolidates fragmented histories across multiple providers into a single structured record. It applies natural language processing to physician notes, discharge summaries, and lab results, then generates a clear, concise report that can be stored in the EHR. - Financial impact
- By providing audit-ready documentation, it reduces the risk of denials due to missing or incomplete history.
- Care teams save hours per week, which directly supports capturing add-on minutes, such as 99439.
- The improved continuity of information ensures that care plans are complete and meet CMS standards for reimbursement.
C. AI Readmission Risk – Preventing Avoidable Utilization
- How it works
AI Readmission Risk predicts which patients are most likely to be readmitted within 30 days of discharge. It takes into account comorbidities, medication adherence, and social determinants of health. - Financial impact
- Proactive interventions lower readmission rates, which is increasingly tied to value-based care outcomes.
- Patients flagged as high risk can be assigned to APCM G0558, which reimburses $117.24 per month.
- The ability to stratify patients into higher complexity categories translates directly into stronger reimbursement.
D. ConnectHealth and WearConnect – Interoperability and Wearable Data
- How it works
- ConnectHealth is designed for seamless EHR integration. It uses HL7 and FHIR standards to connect with Epic, Cerner, and Athenahealth.
- Financial impact
- Interoperability reduces manual data entry, cutting documentation time by up to 50%.
- Continuous remote monitoring increases the opportunities to log care coordination time, which in turn boosts eligibility for add-on billing codes.
- Wearable integration also supports timely interventions, helping practices achieve higher patient engagement rates that correlate with stronger reimbursement.
E. Combined Effect of Accelerators
When applied together, these accelerators can transform CCM economics:
- Enrollment increases as patients experience more personalized care plans.
- Minutes are captured more consistently because staff time is freed from repetitive tasks.
- Denials are reduced by embedding compliance artifacts into workflows.
Hospitals and clinics that deploy this stack of accelerators can move from average reimbursement capture to consistently achieving top-end revenue, while also improving patient outcomes.
X. Common Objections and Answers
Even with favorable reimbursement rates, many practices hesitate to expand or even launch Chronic Care Management programs. Concerns typically fall into four categories: staff cost, patient cost-sharing, EHR integration, and compliance. Addressing these objections with clear strategies is essential for long-term success.
A. “Payments Do Not Cover Staff Time”
- The concern
Practices often believe that the amount paid per patient each month is not enough to offset the cost of hiring and training care coordinators. - The response
- When analyzed correctly, the math shows that CCM supports more staff than expected. For example, a coordinator managing 200 patients billed under 99490 and 99439 can generate over $150,000 in annual revenue.
- This revenue exceeds the cost of a coordinator’s salary and benefits, leaving a margin to reinvest in technology or expand enrollment.
- Efficiency workflows, such as CarePlan AI and AI Medical Summary, further increase the number of patients each staff member can handle, thereby raising productivity without the need for additional hires.
B. “Patients Will Not Pay the Cost-Share”
- The concern
Patients typically pay 20% coinsurance under Medicare Part B, which is approximately $8–$15 per month depending on the service. - The response
- Many patients have supplemental insurance or Medicaid coverage that offsets the cost-share, which reduces the out-of-pocket burden.
- Financial navigation platforms can quickly check eligibility for assistance programs, ensuring that cost is not a barrier.
- Communicating value to patients is also critical. Framing CCM as a service that improves access, reduces hospital visits, and provides a consistent point of contact increases willingness to participate.
C. “Integration Into Epic or Cerner is Too Difficult”
- The concern
Hospitals and large clinics that use enterprise EHRs often view CCM as an operational headache. The assumption is that building care management workflows into Epic or Cerner requires costly, custom development. - The response
- FHIR-native connectors, such as ConnectHealth, reduce integration timelines by utilising standardised APIs.
- Workflows can be embedded directly into EHR surfaces like Epic SmartData Elements or Cerner mPages, allowing staff to remain in their existing systems.
- This approach eliminates dual entry and significantly reduces errors, creating a smoother path to scaling CCM without incurring high IT costs.
D. “Compliance Risk is Too High”
- The concern
Practices worry that billing CCM will attract audits and that missing documentation will lead to recoupments or penalties. - The response
- Compliance risk is real, but it can be mitigated through structured processes. Pre-built templates for consent, care plans, and time logs provide audit-ready artifacts from day one.
- Automating documentation through accelerators ensures that each step meets CMS requirements, reducing the chance of missed elements.
- Quarterly internal audits create a safeguard, enabling providers to correct errors before claims are submitted.
E. Key Takeaway
Each of these objections stems from understandable concerns. However, when practices take a structured approach and leverage available tools, the objections can be reframed as opportunities. Staff time becomes profitable when panels are sized correctly, patient cost-sharing can be mitigated with financial navigation, integration into Epic and Cerner is now faster with standardized APIs, and compliance risk is addressed with audit-ready workflows.
See How CarePlan AI & Medical Summary Cut Staff Workload by 50%
XI. Buyer’s Checklist
Before committing resources to the expansion of Chronic Care Management in 2026, decision-makers need a structured framework to evaluate readiness. A buyer’s checklist helps ensure that practices capture full reimbursement while minimizing operational and compliance risks. The following five areas should be verified before scaling a CCM program.
A. Confirm Code-Level Reimbursement
- Understand national rates
Practices must Review the 2026 Physician Fee Schedule (CMS-1832-F) for exact Medicare payment per code, including traditional CCM, complex CCM, physician-time codes, and APCM bundles. - Apply local adjustments
Geographic practice cost indexes (GPCI) may raise or lower reimbursement slightly depending on location. Buyers should confirm local payment rates before projecting annual revenue. - Align patient mix with codes
Not all patients are alike. High-acuity and socially complex patients may qualify for APCM G0558, while most others remain under traditional CCM codes. Matching the right code to the right population is a critical first step.
B. Ensure Workflow Automation Tools
- Care coordination workflows
Without automation, coordinators spend time on repetitive data entry, which can lead to missing billable minutes. Automation tools streamline scheduling, reminders, and care plan updates. - Documentation capture
Tools such as CarePlan AI or AI Medical Summary can automatically produce care plans and summaries that meet CMS documentation requirements. This reduces staff burden and ensures audit readiness. - Patient engagement automation
Automated outreach through chat or voice bots increases enrollment and improves adherence, which directly impacts revenue.
C. Verify Epic and Cerner Integration
- Integration into EHR surfaces
Any CCM program must operate inside the organization’s existing EHR. Solutions should plug into Epic’s SmartData Elements or Cerner’s mPages so staff can document without leaving their primary system. - Standardized data formats
Buyers should confirm that solutions use HL7 and FHIR standards to ensure interoperability and avoid costly one-off integrations. - Audit trail inside the EHR
Storing consent, care plans, and time logs inside the EHR not only improves efficiency but also provides defensible artifacts during audits.
D. Address Social and Financial Navigation
- Social determinants of health (SDOH)
APCM codes emphasize patient complexity, which includes social risk factors. Buyers need systems that can capture SDOH data through surveys and integrate it into care plans. - Financial navigation tools
Solutions like automated eligibility checks for assistance programs ensure coinsurance obligations do not deter patients. Addressing financial barriers directly improves enrollment percentages. - Population-level analytics
Understanding how social and financial factors impact the patient panel supports more accurate forecasting of APCM versus CCM reimbursement.
E. Establish ROI Dashboards with Sensitivity Analysis
- Enrollment scenarios
Dashboards should model outcomes at 20%, 40%, and 60% enrollment, allowing leaders to plan staffing and financial expectations. - Minutes distribution tracking
Real-time dashboards allow managers to see whether staff are consistently capturing enough minutes to bill add-ons, or if opportunities are being missed. - Denial monitoring
Denials must be tracked and categorized. Dashboards that show the financial impact of denials encourage early intervention and compliance improvements.
Key Takeaway
A structured checklist ensures that CCM programs are not only compliant but also profitable. Confirming reimbursement rates, automating workflows, integrating with Epic or Cerner, addressing social and financial barriers, and building ROI dashboards form the foundation of a sustainable program. Organizations that follow this checklist reduce risk while positioning themselves to capture the full benefit of Medicare’s CCM and APCM reimbursement opportunities.
XII. How Mindbowser Helps
Most CCM programs underperform for the same three reasons: documentation tax eats coordinator capacity, billing logic lives separately from clinical workflow, and the EHR integration is shallow enough that staff still has to type the same data twice.
We approach CCM as a workflow redesign with pre-built components as the shortcut, not as a software install. The work is to identify which pieces of the workflow are pre-built (and ready to deploy in production), which need custom development for your specific EHR and patient panel, and which stay human regardless of the tooling.
The pre-built components that matter most for CCM specifically:
- CarePlan AI handles care-plan drafting from structured patient inputs – production data shows 37% higher patient understanding of the plan and 42% reduction in coordination delays.
- AI Medical Summary consolidates fragmented patient histories into structured records that hold up to OIG documentation scrutiny.
- ConnectHealth is the FHIR-native integration layer that puts CCM workflows inside Epic, Cerner, Athena, and Canvas – embedded in Epic SmartData Elements and Cerner mPages so staff never leave the EHR.
What stays custom: payer-specific billing rules, multi-specialty workflow logic, your specific EHR’s quirks, and the parts of CCM compliance that require defensible audit artifacts unique to your practice’s documentation patterns.
What stays human: SDOH screening conversations, end-of-life planning discussions, culturally calibrated patient communication, and clinical escalation calls. These don’t automate and shouldn’t.
Programs that start from this stack rather than from scratch typically go live in 90–120 days instead of the 6–9 month custom-build timeline. The dollar savings shows up in two places: the coordinator capacity unlock from documentation automation, and the denial reduction from billing logic embedded in clinical workflow rather than reconciled after the fact.
If your CCM program is leaving revenue on the table because the software wasn’t built for your workflow, that’s the gap we close.
Conclusion
In 2026, Medicare reimbursement ranges from $43.76 to $144.29 per patient per month for CCM and up to $117.24 per patient per month for APCM, with behavioral health add-ons pushing APCM reimbursement higher for qualifying patients. CMS increased all chronic care management rates by 8-11%, the largest increase in five years. Small clinics generate steady six-figure revenues while mid-market hospitals scale into millions. Success depends on enrollment optimization, accurate documentation, and denial management — made more urgent by the OIG’s inclusion of CCM in its 2026 Work Plan. CCM represents a core growth strategy for organizations investing in automation, integration, and compliance infrastructure.
Medicare reimburses between $43.76 and $144.29 per patient per month depending on code selection and practice setting. Standard CCM (99490) pays $66.13/month at non-facility rates. Complex CCM (99487) pays $144.29/month. APCM codes range from $16.37 to $117.24 per patient monthly based on condition count and social complexity. CMS increased all rates by 8-11% for 2026.
Yes. Medicare Part B covers Chronic Care Management (CCM) for patients with two or more chronic conditions expected to last at least 12 months or until the end of life. Coverage includes non-face-to-face care coordination, care plan management, and medication oversight.
Medicaid coverage for CCM varies by state. Some states reimburse care coordination through health home programs or managed care models. For dual-eligible patients, Medicare is billed as the primary payer, with Medicaid potentially covering coinsurance.
CCM services can be billed by:
- Physicians (MD/DO)
- Nurse practitioners (NPs)
- Physician assistants (PAs)
- Certified nurse midwives
- Clinical nurse specialists
Billing providers must oversee care, while clinical staff can perform services under general supervision.
Billing requires:
- Patient consent (documented)
- Minimum time thresholds (e.g., 20 minutes for 99490)
- A comprehensive care plan
- Documentation of services and time
Claims are submitted monthly using CPT codes such as 99490, 99487, and add-on codes (99439, 99489).
CCM is time-based, requiring documentation of minutes spent on care coordination.
APCM (Advanced Primary Care Management) is complexity-based, with fixed monthly payments depending on patient conditions and social risk factors.
APCM reduces documentation burden but may yield lower revenue unless complexity is high.
Yes. Patients typically pay 20% coinsurance under Medicare Part B, which is approximately $8–$15 per month, depending on the service.
Many patients have supplemental insurance or Medicaid that covers this cost.
Patients must have two or more chronic conditions, such as:
- Diabetes
- Heart failure
- COPD
- Hypertension
- Chronic kidney disease
- Depression
- Arthritis
These conditions must place the patient at risk of hospitalization, decline, or death.