BLOGS
BLOGS  NEWSROOM
  CASE STUDIES
  WEBINARS
  PODCASTS
  ASSET HUB
  EVENT CALENDAR


Undoubtedly visuals appeal to us way more than long list reports. Visualization allows decision-makers to tell a narrative, encouraging them to respond more rapidly than if the data were viewed on a flat table as long, boring reports. Due to the same, understanding and acknowledging the importance of data visualization in healthcare becomes crucial.
Data visualization can be understood as representing data in the form of visuals like charts and graphs. We need data visualization because it is easier to recognize patterns and trends with a visual overview of data than to look at thousands of rows on a spreadsheet.
It is the way the human brain operates. From the aim of analyzing data, information is valued more and understood better when it is visualized. It communicates and represents the relationship between data and photos.
What is Data Visualization in Healthcare?
Data visualization in healthcare involves presenting complex medical data in visual formats, such as charts, graphs, and maps, to make it more accessible and insightful. It aids healthcare professionals in understanding data trends, enhances decision-making, engages patients, and contributes to quality improvement. This practice is crucial for monitoring diseases, disseminating research findings, and improving overall healthcare outcomes.
Healthcare Data visualization is very important in this data-centric generation of ours, and it comes bearing a lot of benefits, which are discussed in the following sections of this article.
Benefits of Data Visualization in Healthcare
Why is data visualization important for healthcare? In order to maximize data insights, Healthcare Data visualization helps decision-makers in many ways. Let’s explore some of the major benefits of data visualization in healthcare in detail.
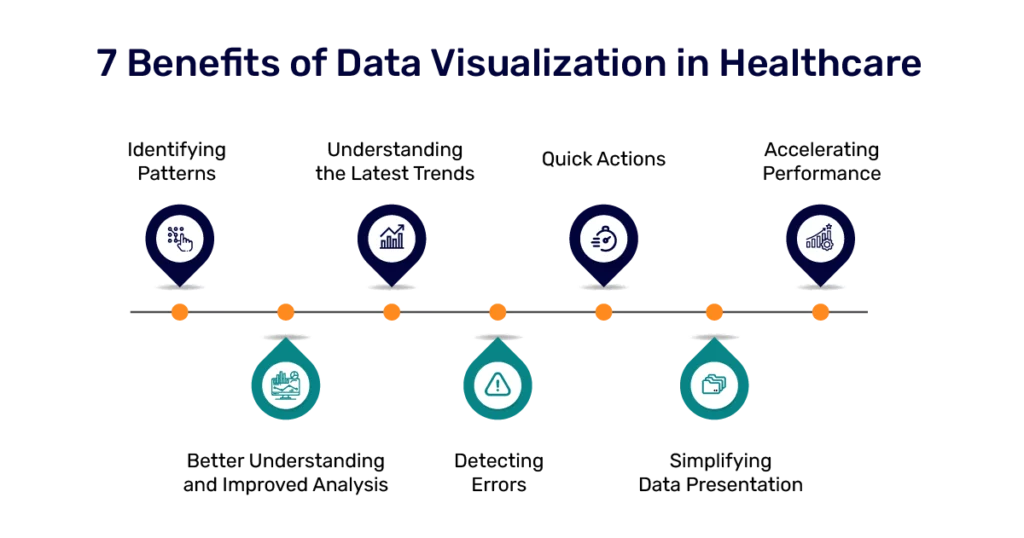
1. Identifying Patterns
Vast volumes of complex data will create many possibilities for observations when we visualize it. Using data visualization, business users are in a better position to understand and give out greater meaning to relationships between the data.
In a professional setting, exploring these trends allows users to concentrate on particular areas that need data attention. This helps them understand the relevance of those areas to move the organization forward with the required efforts.
2. Better Understanding and Improved Analysis
The aim of your dashboard is storytelling. You help the target audience understand the story at a single glance by designing the graphics in a meaningful way. Always make sure to express the story most simply, without complex graphics that are excessive and unnecessary.
Visualizing data enables the stakeholders of a company to evaluate information relating to revenue, marketing campaigns, and interest in the product. They will concentrate on the areas that need attention to improve profitability based on the research, which in turn makes the company more profitable. Hence, by means of data visualization, you cannot just understand the data better but also analyze it.
3. Understanding the Latest Trends
With an enhanced understanding of the data and better analysis, data visualization helps the company to look out for trends. You will uncover the current developments in your market using data visualization to deliver better products and detect issues before they occur. This ensures the smooth functioning of the organization and staying on top of trends; you will bring more focus into moving your company to greater heights.
4. Detecting Errors
By discovering the latest business trends and other developments, data visualization is efficient enough to even identify mistakes. Visualizing the information helps you find any errors in the data easily. Visualizations help detect incorrect data sooner. If the data appears to indicate the wrong behavior, it becomes easier for the user to take necessary actions and exclude it from the analysis.
5. Quick Actions
As previously mentioned, visuals are more readily grasped by the human brain than table records. Data visualizations empower decision-makers to be easily informed of new data insights and take the steps required for business development. This speeds up the processes and minimizes the time spent on thinking and planning future actions and operations.
6. Simplifying Data Presentation
Healthcare visualization is like a superhero in the world of medical data. It swoops in to rescue us from the confusion of complex information, especially when healthcare experts from different fields are trying to make sense of it all.
The mission here is clear: to simplify the complicated stuff so everyone can understand it. Think of it as using charts and graphs to show how common diseases are and what factors affect them. This superpower makes medical data more valuable and easy to grasp for everyone, regardless of background, promoting teamwork and smarter decisions in healthcare.
7. Accelerating Performance
Data visualization is a cornerstone of improved healthcare provider performance, offering the invaluable ability to quickly translate complex data into actionable insights. This swiftness in decision-making is especially crucial in critical scenarios, directly impacting patient outcomes and overall health.
Organizations enhance their efficiency and reputation for excellence by minimizing inadequacies in healthcare delivery. Ultimately, data visualization catalyzes improved patient outcomes and elevates the quality of healthcare services, benefiting both providers and the patients they serve.
How is Data Visualization Transforming The Healthcare Industry?
Efficient and meaningful data visualization is at the core of many medical studies. It is also important for a lot of doctors, physicians, nurses and others as they use and interacts with health interfaces on an everyday basis to generate patient reports and related information.
Data visualization focuses on the health industry’s most significant takeaways, helping us recognize the latest trends and associations, and making the process of data analysis more efficient. The healthcare industry is exploring several digital techniques to create a predictive model of activity in order to express a comprehensive database and to stimulate ties with the latest trends.
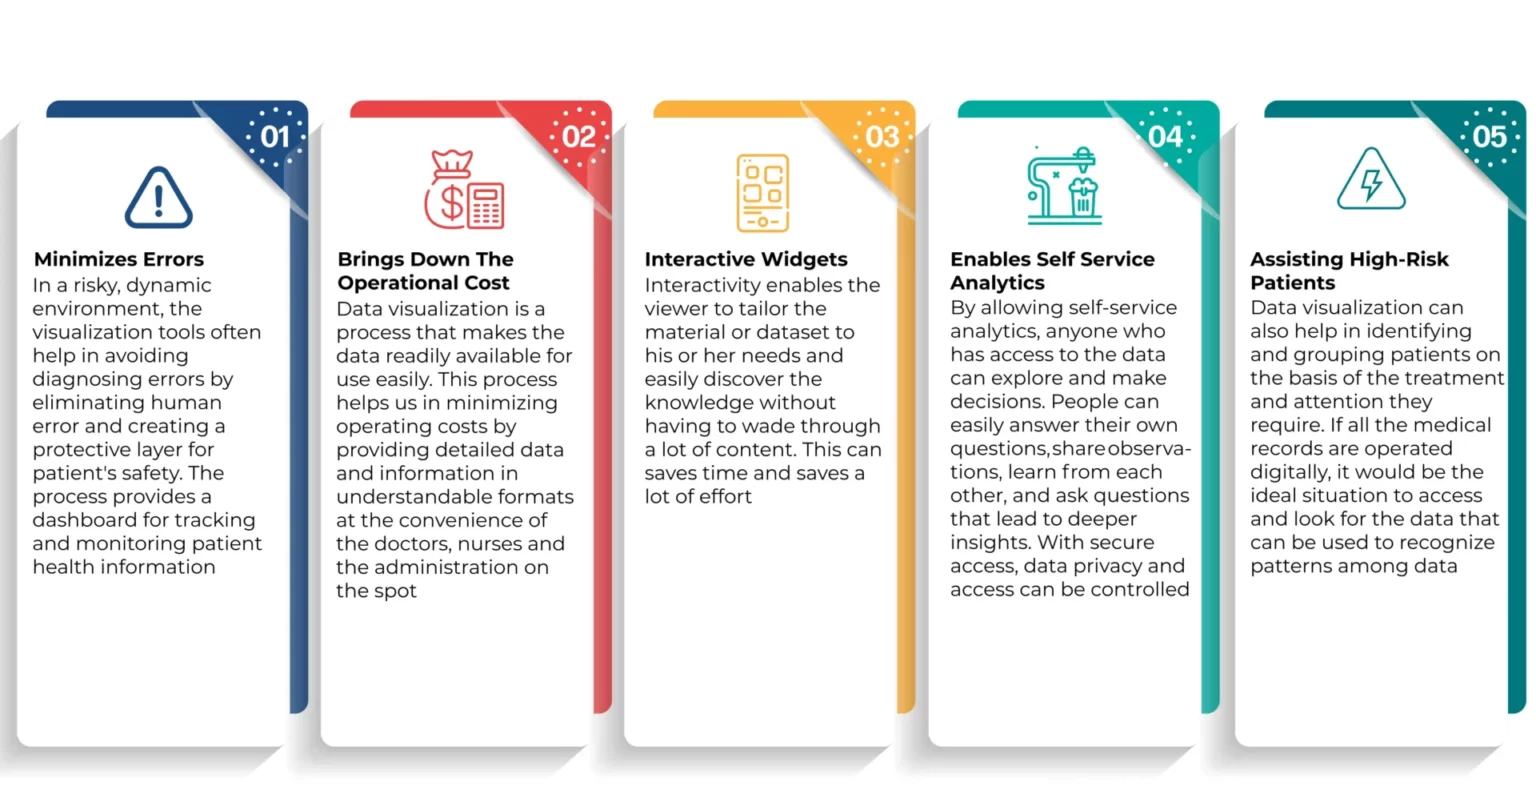
Almost all healthcare centres across the globe have adopted data visualization solutions to manage their routine in-house operations. From patient profiling and recording patient information to maintaining and managing satisfaction surveys and complaint registers, hospitals have started to completely rely on data visualization for all these activities and much more. Some of the reasons why visualization techniques in the healthcare segment must be practised are listed below.
Minimizes Errors
In a risky, dynamic environment, the tools of visualization often help in avoiding diagnosing errors by eliminating human error and creating a protective layer for patient safety. This becomes essential for keeping sensitive patient data and information protected.
The process provides a dashboard for tracking and monitoring patient health information. This dashboard is represented in the form of e-health records and e-medical records.
Dashboards that help medical professionals analyze vast sets of information easily can save time and even save lives. It is a computer-based recording system that makes it easier to understand ongoing medical operations and systems better.
Brings Down The Operational Cost
Data visualization is a process that makes the data readily available for use easily. This process helps us in minimizing operating costs by providing detailed data and information in understandable forms at the convenience of the doctors, nurses, and the administration on the spot.
The systems enable healthcare professionals to procure unique knowledge and information about the demographics and lifestyle preferences of their patients. This further helps them in tracking and healing the patients accordingly.
Interactive Widgets
When you have loads and loads of data to share, you can never choose and pick only a few key points to illustrate. This is also the case when you are looking at state-by-state health information through a number of indicators. Still, to various members of your audience, some elements of the knowledge might be more important than others. If this describes the kind of data set you are working with, the best match for your content could be an interactive widget or a dashboard.
Interactivity enables the viewer to tailor the material or dataset to his or her needs and easily discover the knowledge without having to wade through a lot of content they just do not care about. This can save time and saves a lot of effort.
Enables Self Service Analytics
An environment where data is secure and handled by IT allows the company to embark on self-service data analytics and data visualization because they trust the data. Similarly, IT and the leadership of the company will trust that the data governance model assures that the right people have access right to the data.
This is the cornerstone of a culture of self-service data visualization and analytics. What they see is tied to their position and who they are. By allowing self-service analytics, anyone who has access to the data can explore and know better.
People can easily answer their own questions, share observations, learn from each other, and ask questions that lead to deeper insights. Since the data is on a centrally controlled network that is regulated by IT, each physician would only be able to see and explore data that is accessible to them under the security model.
Assisting High-Risk Patients
Healthcare Data visualization can also help in identifying and grouping patients on the basis of the treatment and attention they require. If all the medical records are operated digitally, it would be the ideal situation to access and look for the data that can be used to recognize the pattern of many patients.
It will recognize the patients visiting the hospital repeatedly and identify their chronic problems. Such awareness and analysis would aid in providing the patients with accurate treatment and provide insight into corrective steps to minimize their repeated visits.
It is the most appropriate way to create and maintain a list and check on high-risk patients and give them the personalized treatment they deserve.

Why Mindbowser for Data Visualization Services?
Our experienced and agile team of full-stack engineers, data scientists, and mobile app developers accelerate innovation and implementation of customizable ML and AI products. Our experts bring vast cross-industry expertise supported by scientific rigor and in-depth knowledge of advanced techniques to design, develop, and deploy bespoke data solutions.
Data visualization in healthcare can enhance patient engagement by presenting medical information in a clear and understandable way. Visual representations of health data, such as charts or graphs, make it easier for patients to comprehend their health status, treatment options, and progress, leading to more informed decisions and increased involvement in their care.
Visualization in healthcare significantly enhances performance by providing a visual summary of complex healthcare data. This enables healthcare professionals to identify trends, anomalies, and insights more efficiently. It aids in diagnosis, treatment planning, and resource allocation, ultimately improving patient outcomes and operational efficiency within healthcare organizations.
Data visualization is crucial in healthcare analytics as it simplifies the interpretation of vast and intricate healthcare data sets. It helps healthcare analysts and decision-makers make data-driven decisions, discover patterns, and track key performance indicators. This ultimately leads to better patient care, cost management, and the overall improvement of healthcare systems.