Data visualization consulting services involves working with businesses to translate their data into visual formats such as charts, graphs, and dashboards. This process goes beyond mere aesthetics; it’s about creating visuals that tell a compelling story about the data. A skilled data visualization consultant can help you uncover hidden patterns, trends, and opportunities that might otherwise go unnoticed.

Building a strong data foundation is crucial for success. Our consultants will work with you to define your data goals, identify data sources, and create a roadmap for achieving your objectives. We’ll help you prioritize initiatives, allocate resources effectively, and ensure that your data strategy aligns with your overall business strategy.

Choosing the right data visualization tools is essential for creating effective visuals. We’ll assess your specific needs and recommend the best tools for your team. Our experts will handle the implementation process, ensuring seamless integration with your existing systems and providing comprehensive training to your staff.

Dashboards and reports are powerful tools for communicating insights. We’ll design custom dashboards and reports that are tailored to your specific needs and audience. Our focus is on creating clear, informative, and interactive visuals that deliver actionable insights at a glance.

Data visualization is not just about creating pretty pictures. It’s about crafting compelling narratives that resonate with your audience. Our consultants will help you transform complex data into engaging stories that drive understanding and action. We’ll teach you how to communicate your findings effectively, whether you’re presenting to executives, stakeholders, or customers.

Data can be used to predict future trends and outcomes. Our experts will help you leverage predictive analytics to uncover valuable insights and make data-driven decisions. We’ll combine advanced statistical modeling with powerful visualization techniques to create forecasts and scenarios that inform your business strategy.

Your data landscape is constantly evolving. We offer ongoing support and maintenance services to ensure that your data visualizations remain accurate, relevant, and up-to-date. Our team will monitor your data, identify trends, and make recommendations for improvements. We’ll also provide training and support to your team to ensure they can effectively use and maintain your data visualizations.
Effective data visualizations provide quick and easy access to key insights, enabling you to make faster and more informed decisions.
By identifying bottlenecks and inefficiencies, data visualizations can help you optimize your operations and reduce costs.
Uncovering new market opportunities and customer trends can lead to increased sales and revenue growth.
Data visualization fosters a data-centric culture within your organization, empowering employees to make data-informed decisions at all levels.
Clear and compelling data visualizations enhance communication and collaboration among teams and stakeholders.
Gain a competitive edge by utilizing data insights to outmaneuver your competitors.

Our consultants have a deep understanding of various industries and business domains. This allows us to tailor our services to your specific needs and challenges. We'll leverage our industry expertise to provide valuable insights and recommendations.

We have a strong track record of delivering successful data visualization projects for clients across different industries. Our experience and expertise ensure that you'll achieve your desired outcomes.

We are passionate about data and its potential to drive business growth. Our data-centric approach ensures that we focus on delivering accurate, reliable, and actionable insights. We'll treat your data with the utmost care and security.

Our clients are at the heart of everything we do. We work closely with you to understand your unique requirements and goals. We'll be your trusted partner throughout the data visualization process, providing exceptional service and support.

We stay up-to-date with the latest data visualization tools and technologies. This ensures that you benefit from the most advanced and effective solutions. We'll leverage cutting-edge technology to deliver innovative and impactful visualizations.

The customer is a machine learning service provider that allows non-technical business professionals to select, train, and apply machine learning to their business. Based in Bellevue, Washington, the company was looking for a reliable partner who could deliver an end-to-end data analytics solution for them.

The platform is part of the work done by Mindbowser for The New York Genome Center (NYGC). NYGC is an independent nonprofit academic research institution in New York. The client approached Mindbowser to convert the old application into a new stack. The old application had quality and performance issues. We differentiated all tasks in Jira stories and created sprints to boost the development speed and give proper and on-time delivery.

ProofPilot is a healthcare tech platform that allows individuals to
design, manage, launch, and participate in research studies. ProofPilot keeps the data on the platform secure while providing tools to the user to conduct their research studies.
ProofPilot has raised 2Mn in Venture Capital to date
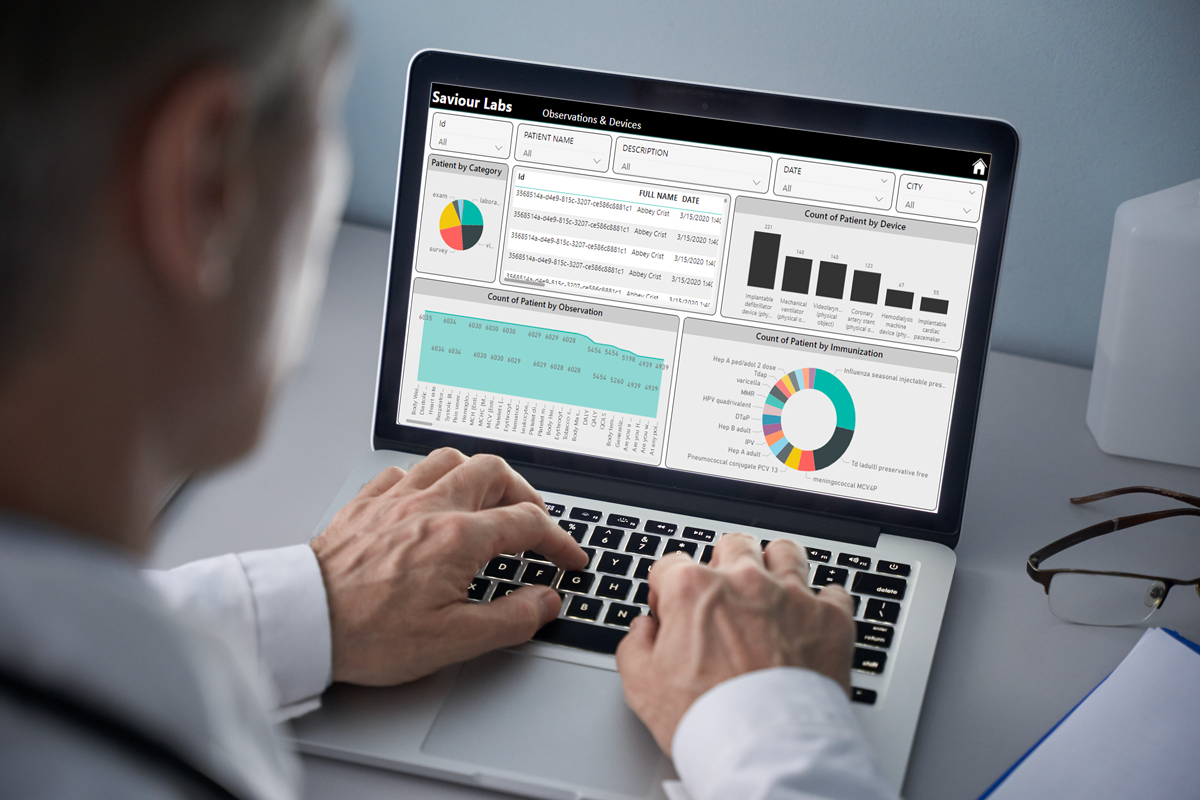
Our high-quality equipment enhances diagnostics and patient care, aiming to revolutionize the industry. The platform delivers devices with user-friendly dashboards, streamlining management for hospitals and providers.


Delivering the best solutions starts with understanding the business needs. Our approach is tailored to meet your unique goals and objectives.
The duration of a data visualization project varies depending on the project scope, complexity, and data availability. However, we work closely with our clients to establish clear timelines and milestones.
The cost of data visualization consulting services depends on several factors, including project scope, data complexity, and the level of customization required. We offer flexible pricing options to meet your budget.
Yes, we provide comprehensive data visualization training programs tailored to your team’s needs. Our training sessions cover various topics, including data storytelling, dashboard design, and tool usage.
Partner with us to design, build, and scale digital solutions that drive better outcomes.
Global Tech Teams LLC, 525 Washington Blvd, Industrious at Newport Tower, Jersey City, NJ 07310, United States.
Let’s discuss your goals, workflows, and next steps in a focused consultation call.


 BLOGS
BLOGS  NEWSROOM
  CASE STUDIES
  WEBINARS
  PODCASTS
  ASSET HUB
  EVENT CALENDAR