In the competitive world of products, organizations can’t bear the cost of a momentous downtime or a lesser than par performance. Execution issues can harm a brand and small incidents can lead to long-term effects. For example, one of our customers who runs a ticketing platform gets 100X times of normal day traffic during NBL finals and other sports showcase events. If a glitch in performance were to happen at that time, it will not only impact their brand at that moment but also snowball quickly to the long-term loss for the brand because next time, the audience may choose an alternative brand.
Similarly, organizations can’t take risks related to security, access control, compliance, etc. If not handled properly, companies can end up with hefty fines, which can sometimes even break the business. Keeping this in mind, we always advocate for proper monitoring and management of IT during and post product development. In this blog, we share further about the need for monitoring and how we have leveraged OpenDistro for ElasticSearch to build a recipe for modern IT infrastructure monitoring and management.
You Can Check Out Our Detailed Video Below
Monitoring systems are responsible for gathering data from the interfaces used by a product (hardware, networks, applications) in order to analyze their operation and performance and to detect and alert about possible errors. A good monitoring system is able to monitor devices, infrastructures, applications, services, and even business processes.
Just like one cannot cross a maze blindfolded, a company cannot traverse through the IT risks without a proper plan and strategy. Similar to data, we also analyze infrastructure using event logs, resource metrics, APM (Application performance traces). A comprehensive strategy comprises both analysis and analytics. An analysis is done on past information, while analytics is built to comprehend future trends.
So, How do we leverage Monitoring tools? At Mindbowser, we use Elastic stack for IT infrastructure Monitoring. A log management platform that is mainly focused on searching, analyzing and visualizing logs generated from various distributed systems.
It mainly contains 4 components
The following image shows how the different aspects of the solution work together
 Fig: Elastic Stack architecture for monitoring management
Beat’s agents are installed on servers to gather logs, metrics and network packet data. The data is then transformed and shipped through logstash servers, where the data is transformed, tagged, and then sent to elastic search nodes to be indexed
Open Distro for Elasticsearch is an open-source alternative for Elasticsearch and Kibana with a large number of open-source plugins. These plugins add further utility and can be used as per needs.
Additionally, we use Wazuh for security and compliance monitoring. Wazuh is a free, open-source project forked from OSSEC which is a host-based intrusion detection system (HIDS). It is an enterprise-ready security monitoring solution for threat recognition, integrity monitoring, incident response, and compliance.
Kibana has Wazuh modules to envision various threats and compliance reports and security events etc. The biggest advantage of our custom monitoring solution is it is flexible, scalable with no vendor lock-in and no license cost. Free large community support and trusted by a huge number of big business clients.
Following are the things that we help our customers with
For deployment of monitoring setup, we have written a custom script to be able to easily set up the environment. The setup combines elastic stack with Wazuh server installation and includes agent installation on application servers. We also added preconfigured kibana dashboards, alerts, users, notification integration etc., which makes the solution effective from day one.
As we know, every product requires best practices in development, scalability, security, compliance etc., throughout its cycle. Monitoring tools help in managing IT infrastructure through audit logs and performance alerts as well and monitor adherence to compliance related to GDPR, PCI and HIPAA. We use the tool Filebeat for log aggregation and Metricbeat for metrics data aggregation.
Logs from the system are used for monitoring file integrity, capturing unwanted traffic to the server, troubleshooting etc and application logs are maintained for compliance and debugging purposes.
Application logs of all environments are in one place so that they are easily available to developers or QA engineers. This way, the team does not have to give ssh access to application server developers. This can restrict unwanted activities on the server and save time also.
We have created dashboards for application logs and container logs in Kibana and have also restricted access to environments based on roles.
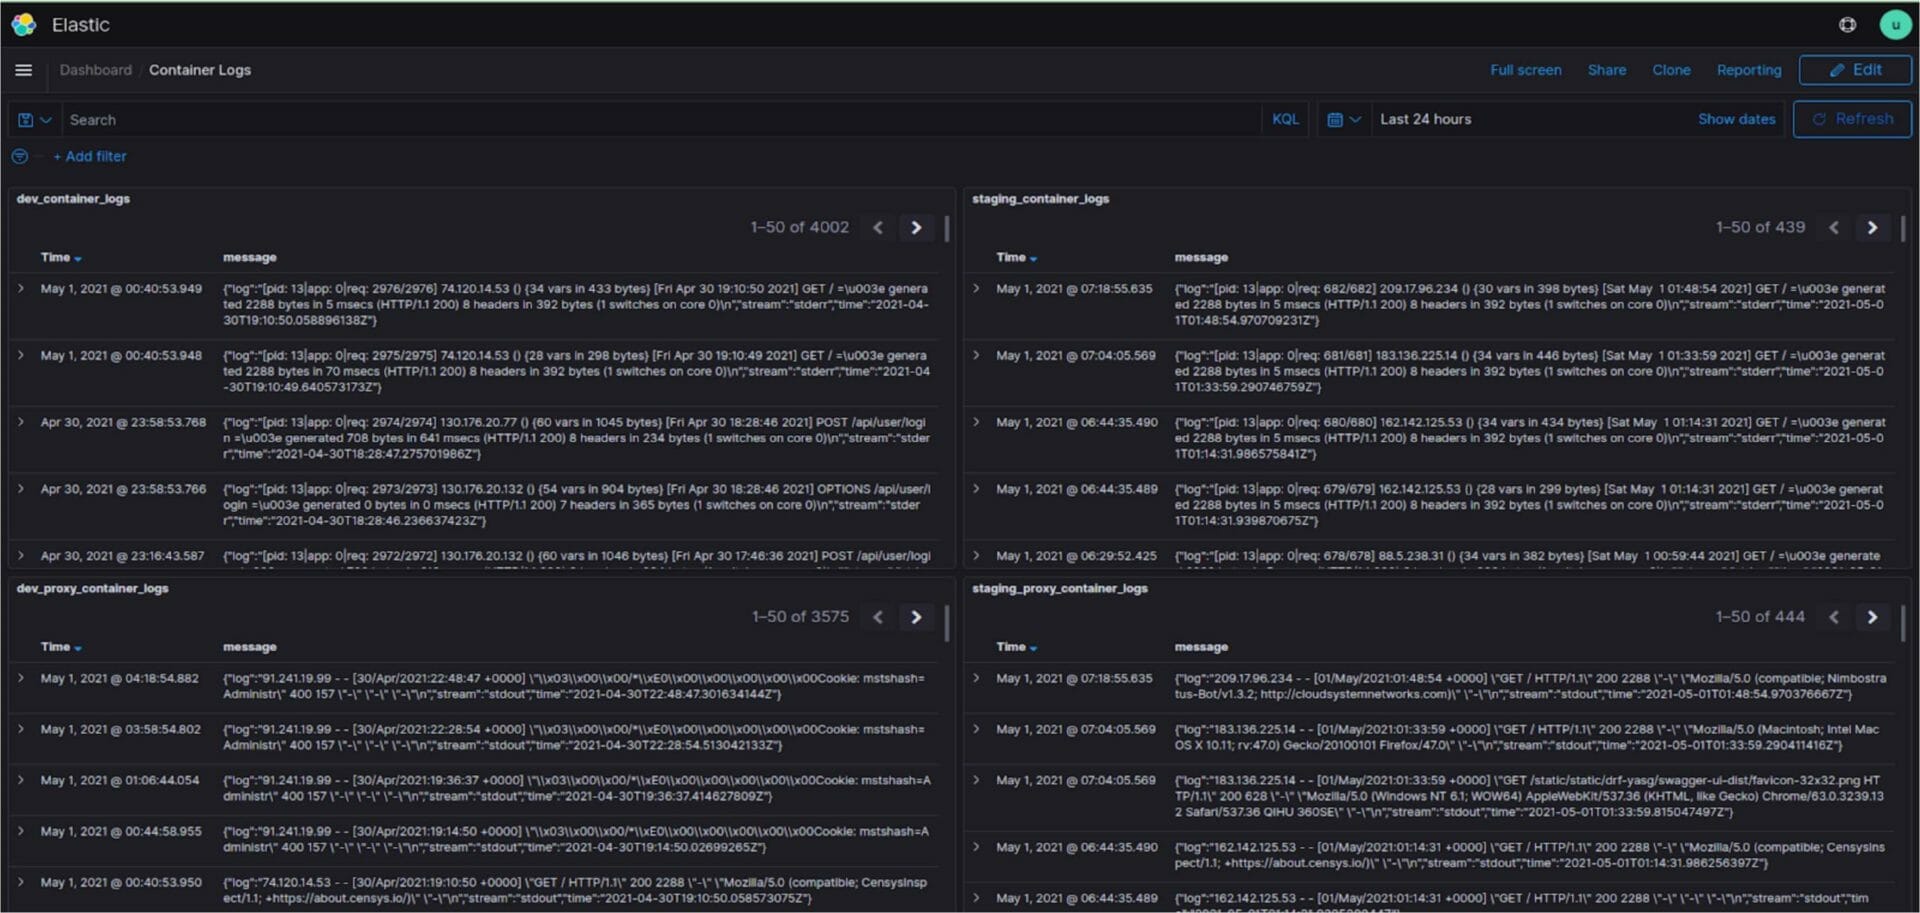 Fig: Containers logs from different environments in a single dashboard
Metrics data from the system is used to visualize system resources and performance in the Kibana dashboard. We can set alerts on specific events such as high disk usage.
Dashboards for various resources can be very useful to make decisions to maintain the system as well as provide a quick birds eye view on the status of things so as to be able to know where we can improve or need to scale up/down the resources. This way we guarantee that applications are accessible, performing and secured consistently.
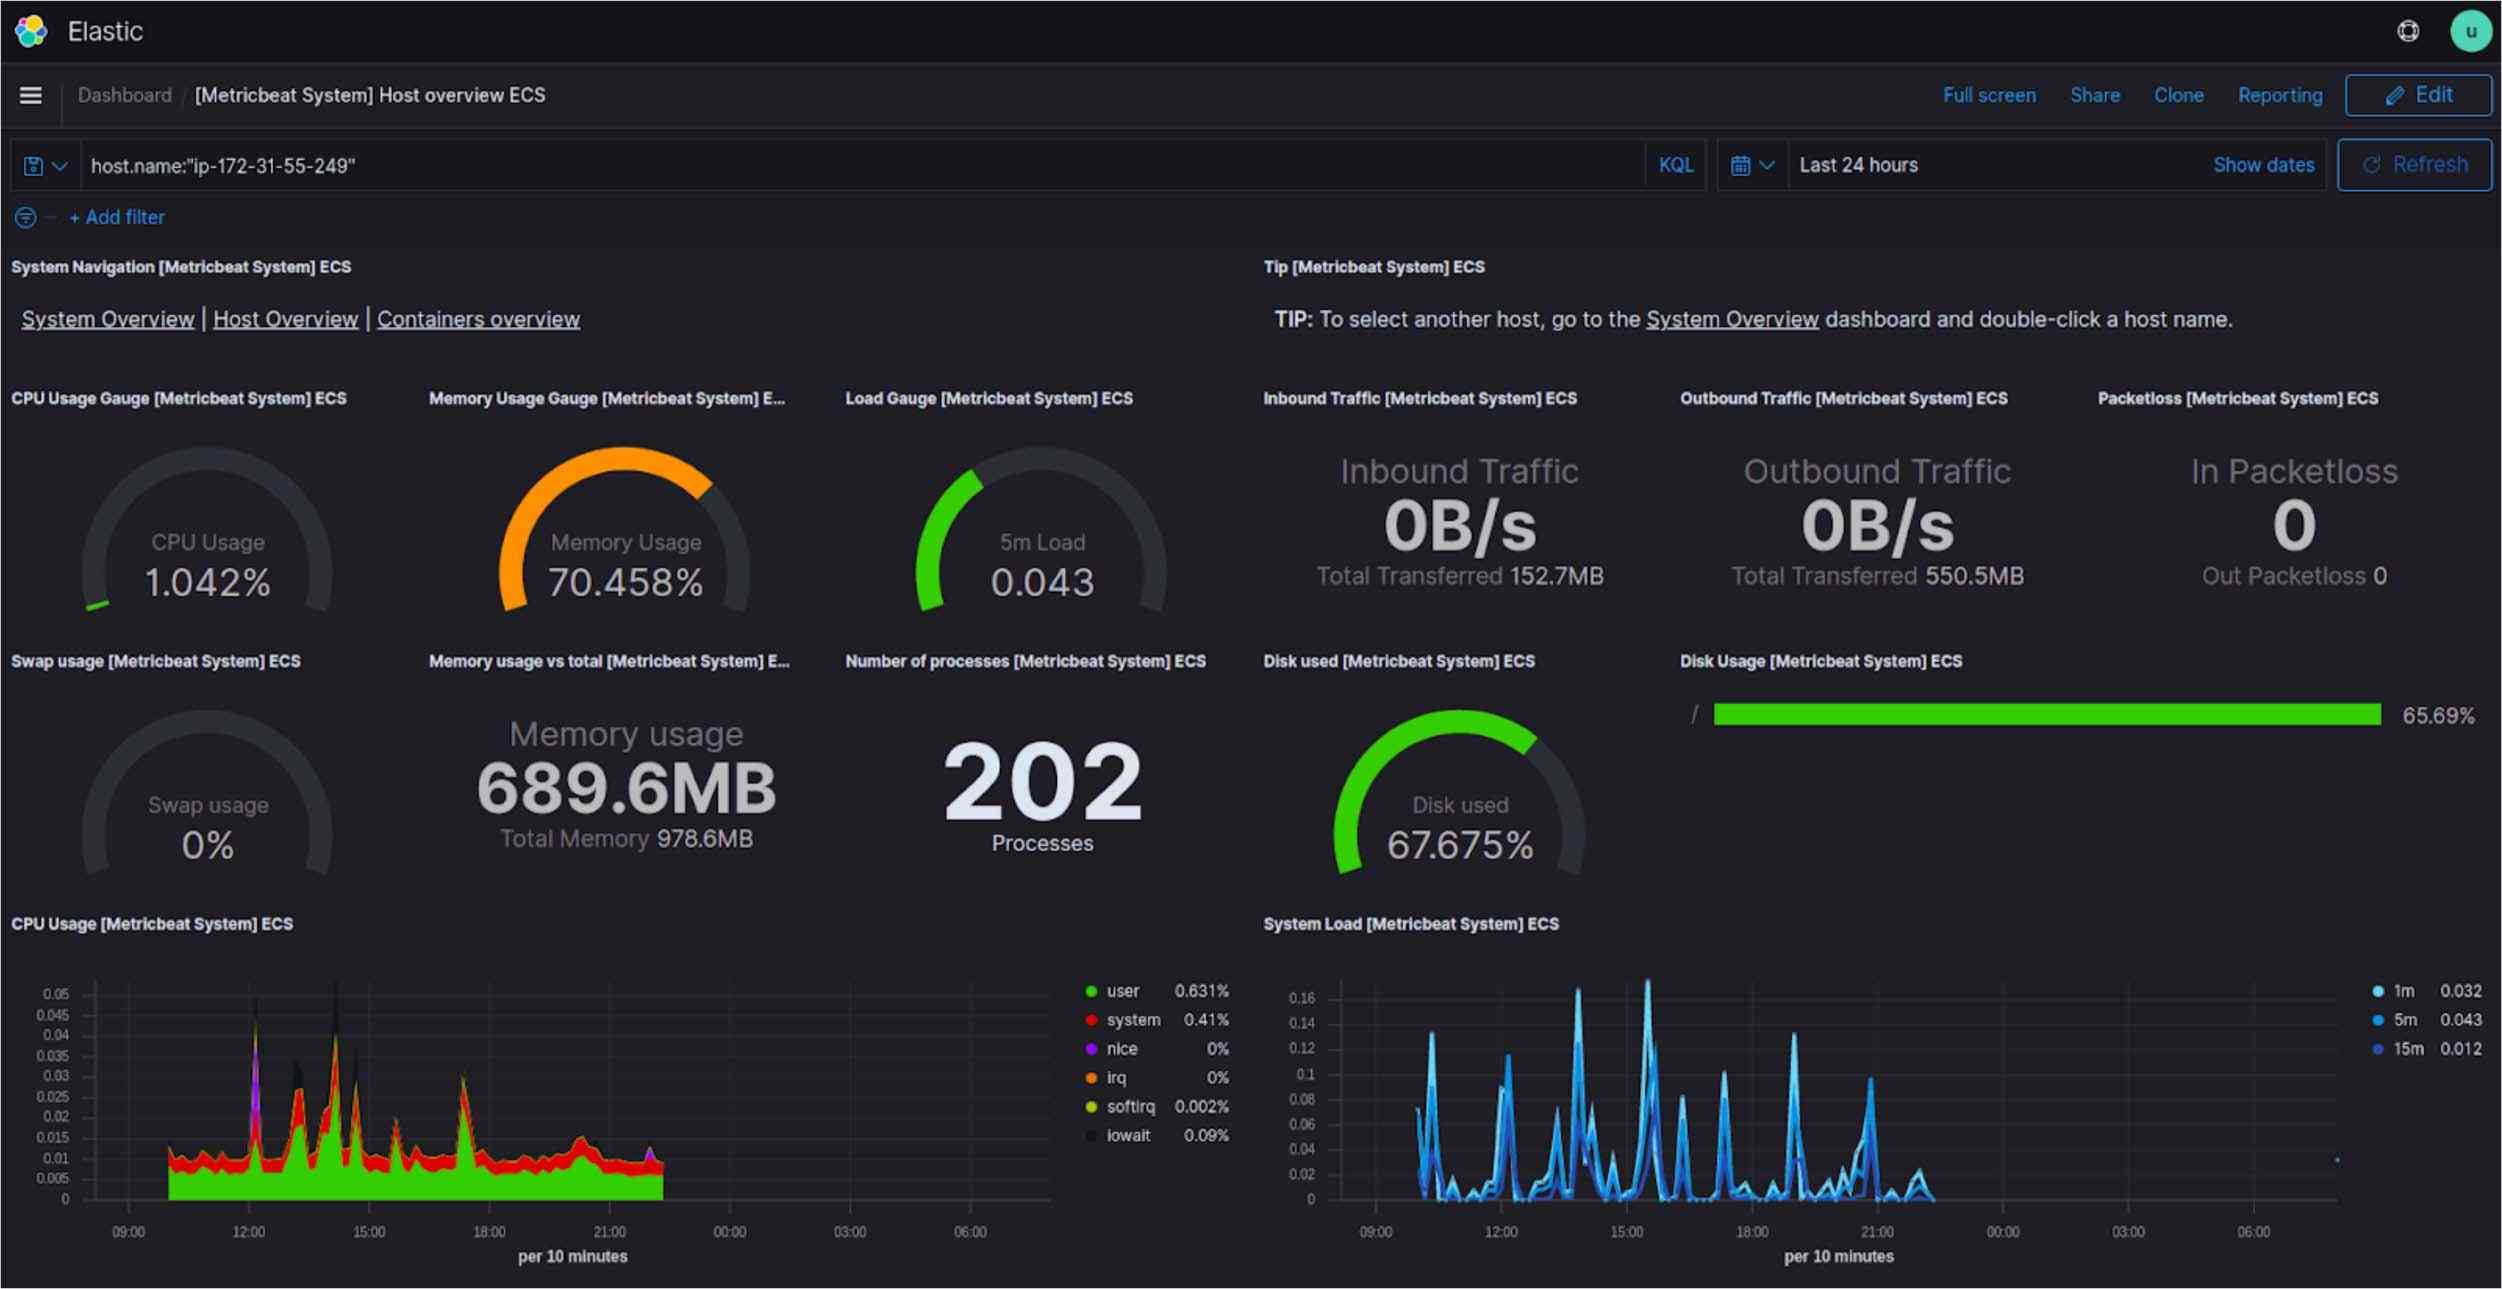 Fig: Sample resources monitoring dashboard
 Fig: Sample alert dashboard
Wazuh gives us reports on our system security events like failed ssh attempts, brute force attacks, modified files, compliance report, security configuration assessment, vulnerabilities etc.
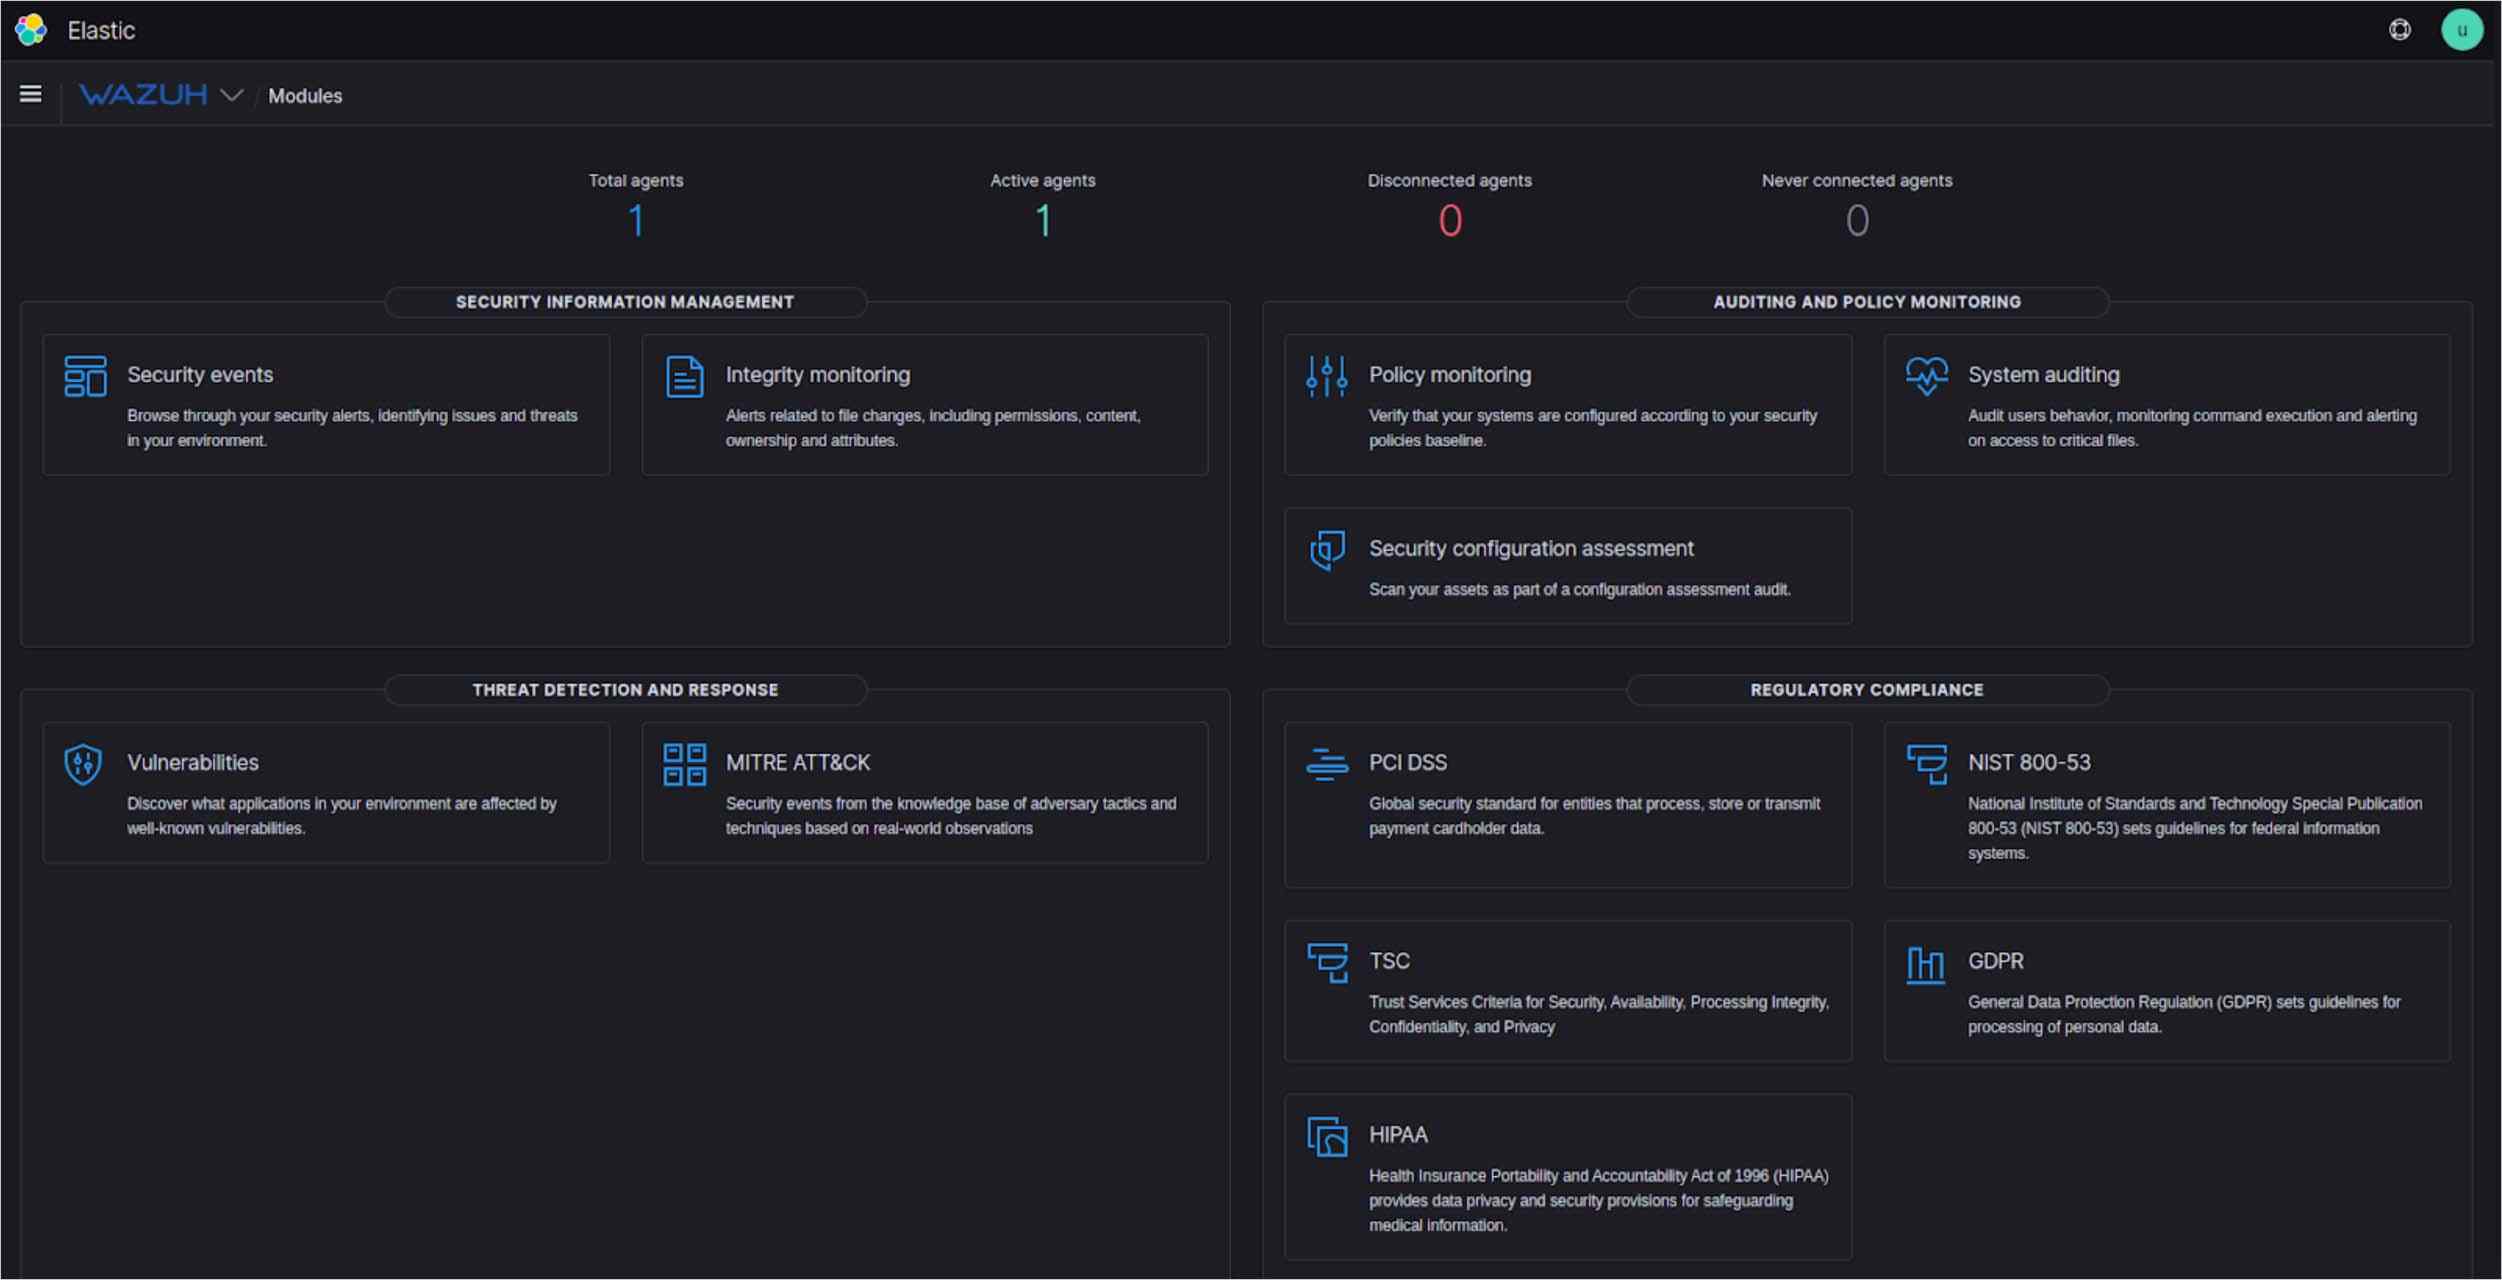 Fig: Wazuh dashboard
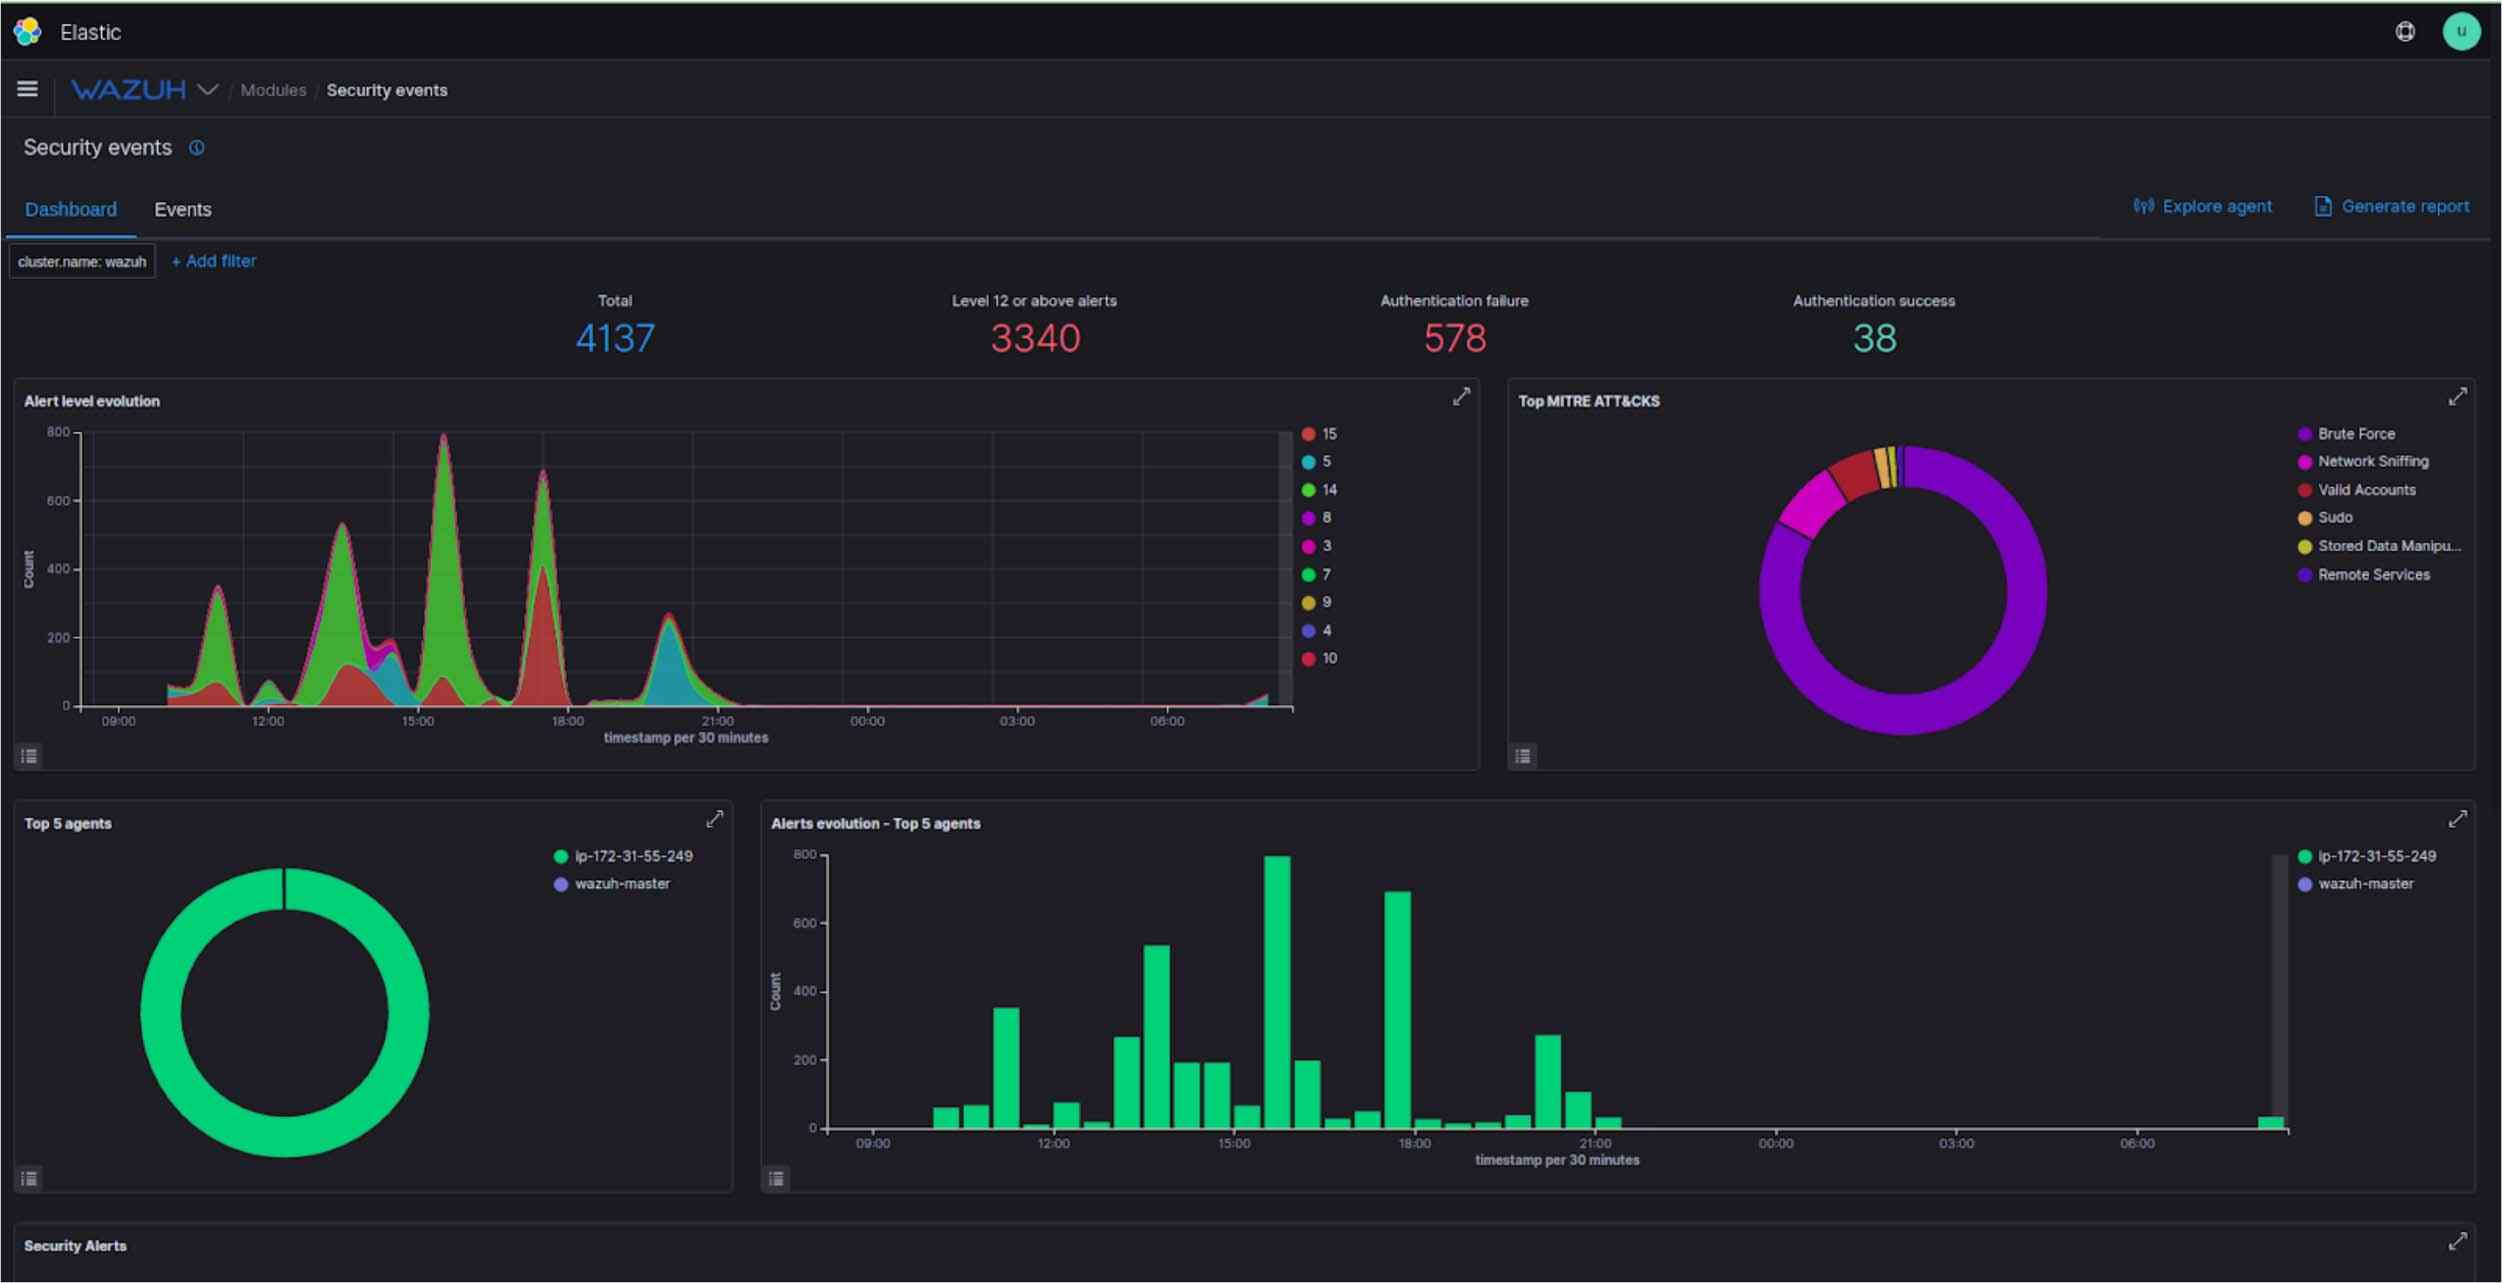 Fig: Security events dashboard

In all, we have discussed creating a strong and stable monitoring system. As highly available cloud-native infrastructure and application workloads become more available and secure, more care needs to be taken to get the monitoring systems right and to be sure that you are using dependable metrics to dynamically manage your environment.
These monitoring tools search for things like outside threats, misconfigured settings, unreasonably lenient jobs and permissions and consistency with norms like PCI, HIPAA, GDPR. Together, these are items that give full security to the DevOps cycle of your product. In the end, it is one’s choice to use a tool based on their needs and their infrastructure. All tools in the above article are open-source tools and are used by various organizations for their monitoring purposes.

We worked with Mindbowser on a design sprint, and their team did an awesome job. They really helped us shape the look and feel of our web app and gave us a clean, thoughtful design that our build team could...

The team at Mindbowser was highly professional, patient, and collaborative throughout our engagement. They struck the right balance between offering guidance and taking direction, which made the development process smooth. Although our project wasn’t related to healthcare, we clearly benefited...

Founder, Texas Ranch Security
Mindbowser played a crucial role in helping us bring everything together into a unified, cohesive product. Their commitment to industry-standard coding practices made an enormous difference, allowing developers to seamlessly transition in and out of the project without any confusion....

CEO, MarketsAI
I'm thrilled to be partnering with Mindbowser on our journey with TravelRite. The collaboration has been exceptional, and I’m truly grateful for the dedication and expertise the team has brought to the development process. Their commitment to our mission is...

Founder & CEO, TravelRite
The Mindbowser team's professionalism consistently impressed me. Their commitment to quality shone through in every aspect of the project. They truly went the extra mile, ensuring they understood our needs perfectly and were always willing to invest the time to...

CTO, New Day Therapeutics
I collaborated with Mindbowser for several years on a complex SaaS platform project. They took over a partially completed project and successfully transformed it into a fully functional and robust platform. Throughout the entire process, the quality of their work...

President, E.B. Carlson
Mindbowser and team are professional, talented and very responsive. They got us through a challenging situation with our IOT product successfully. They will be our go to dev team going forward.

Founder, Cascada
Amazing team to work with. Very responsive and very skilled in both front and backend engineering. Looking forward to our next project together.

Co-Founder, Emerge
The team is great to work with. Very professional, on task, and efficient.

Founder, PeriopMD
I can not express enough how pleased we are with the whole team. From the first call and meeting, they took our vision and ran with it. Communication was easy and everyone was flexible to our schedule. I’m excited to...

Founder, Seeke
We had very close go live timeline and Mindbowser team got us live a month before.

CEO, BuyNow WorldWide
If you want a team of great developers, I recommend them for the next project.

Founder, Teach Reach
Mindbowser built both iOS and Android apps for Mindworks, that have stood the test of time. 5 years later they still function quite beautifully. Their team always met their objectives and I'm very happy with the end result. Thank you!

Founder, Mindworks
Mindbowser has delivered a much better quality product than our previous tech vendors. Our product is stable and passed Well Architected Framework Review from AWS.

CEO, PurpleAnt
I am happy to share that we got USD 10k in cloud credits courtesy of our friends at Mindbowser. Thank you Pravin and Ayush, this means a lot to us.

CTO, Shortlist
Mindbowser is one of the reasons that our app is successful. These guys have been a great team.

Founder & CEO, MangoMirror
Kudos for all your hard work and diligence on the Telehealth platform project. You made it possible.

CEO, ThriveHealth
Mindbowser helped us build an awesome iOS app to bring balance to people’s lives.

CEO, SMILINGMIND
They were a very responsive team! Extremely easy to communicate and work with!

Founder & CEO, TotTech
We’ve had very little-to-no hiccups at all—it’s been a really pleasurable experience.

Co-Founder, TEAM8s
Mindbowser was very helpful with explaining the development process and started quickly on the project.

Executive Director of Product Development, Innovation Lab
The greatest benefit we got from Mindbowser is the expertise. Their team has developed apps in all different industries with all types of social proofs.

Co-Founder, Vesica
Mindbowser is professional, efficient and thorough.

Consultant, XPRIZE
Very committed, they create beautiful apps and are very benevolent. They have brilliant Ideas.

Founder, S.T.A.R.S of Wellness
Mindbowser was great; they listened to us a lot and helped us hone in on the actual idea of the app. They had put together fantastic wireframes for us.

Co-Founder, Flat Earth
Ayush was responsive and paired me with the best team member possible, to complete my complex vision and project. Could not be happier.

Founder, Child Life On Call
The team from Mindbowser stayed on task, asked the right questions, and completed the required tasks in a timely fashion! Strong work team!

CEO, SDOH2Health LLC
Mindbowser was easy to work with and hit the ground running, immediately feeling like part of our team.

CEO, Stealth Startup
Mindbowser was an excellent partner in developing my fitness app. They were patient, attentive, & understood my business needs. The end product exceeded my expectations. Thrilled to share it globally.

Owner, Phalanx
Mindbowser's expertise in tech, process & mobile development made them our choice for our app. The team was dedicated to the process & delivered high-quality features on time. They also gave valuable industry advice. Highly recommend them for app development...

Co-Founder, Fox&Fork