Effective debugging is the cornerstone of successful software development. In this blog, we’ll explore a game-changing tool in the Django ecosystem: Django-debug-toolbar. This powerful package is designed to empower developers with comprehensive insights into their code’s performance, making the debugging process not just efficient but downright enlightening.
As we delve into the world of Django-debug-toolbar, we’ll guide you through the installation, configuration, and practical use of this indispensable tool. You’ll discover how it can reveal crucial information about your Django application’s inner workings, from database queries to API call times.
For Debugger, we are going to use Django-debug-toolbar, This package will show you all the data you need to know about your code, which is given below:
Each of the following steps needs to be configured for the Debug Toolbar to be fully functional.
The recommended way to install the Debug Toolbar is via pip:
python -m pip install django-debug-toolbar
If you aren’t familiar with pip, you may also obtain a copy of the debug_toolbar directory and add it to your Python path.
To test an upcoming release, you can install the in-development version instead with the following command:
python -m pip install -e https://github.com/Ronakjain515/django-debugger-toolbar-demo
The Debug Toolbar requires two things from core Django. These are already configured in Django’s default startproject template, so in most cases, you will already have these setups.
First, ensure that ‘django.contrib.staticfiles’ is in your INSTALLED_APPS setting, and configured properly:
INSTALLED_APPS = [
# ...
"django.contrib.staticfiles",
# ...
]

STATIC_URL = "static/"
Second, ensure that your TEMPLATES setting contains a DjangoTemplates backend whose APP_DIRS options is set to true:
TEMPLATES = [
{
"BACKEND": "django.template.backends.django.DjangoTemplates",
"APP_DIRS": True,
# ...
}
]Add “debug_toolbar” to your INSTALLED_APPS setting:
INSTALLED_APPS = [
# ...
"debug_toolbar",
# ...
]
Add django-debug-toolbar’s URLs to your project’s URLconf:
from django.urls import include, path

urlpatterns = [
# ...
path('__debug__/', include('debug_toolbar.urls')),
]
This example uses the __debug__ prefix, but you can use any prefix that doesn’t clash with your application’s URLs.
The Debug Toolbar is mostly implemented in a middleware. Add it to your MIDDLEWARE setting:
MIDDLEWARE = [
# ...
"debug_toolbar.middleware.DebugToolbarMiddleware",
# ...
]
The Debug Toolbar is shown only if your IP address is listed in Django’s INTERNAL_IPS setting. This means that for local development, you must add “127.0.0.1” to INTERNAL_IPS. You’ll need to create this setting if it doesn’t already exist in your settings module:
INTERNAL_IPS = [
# ...
"127.0.0.1",
# ...
]
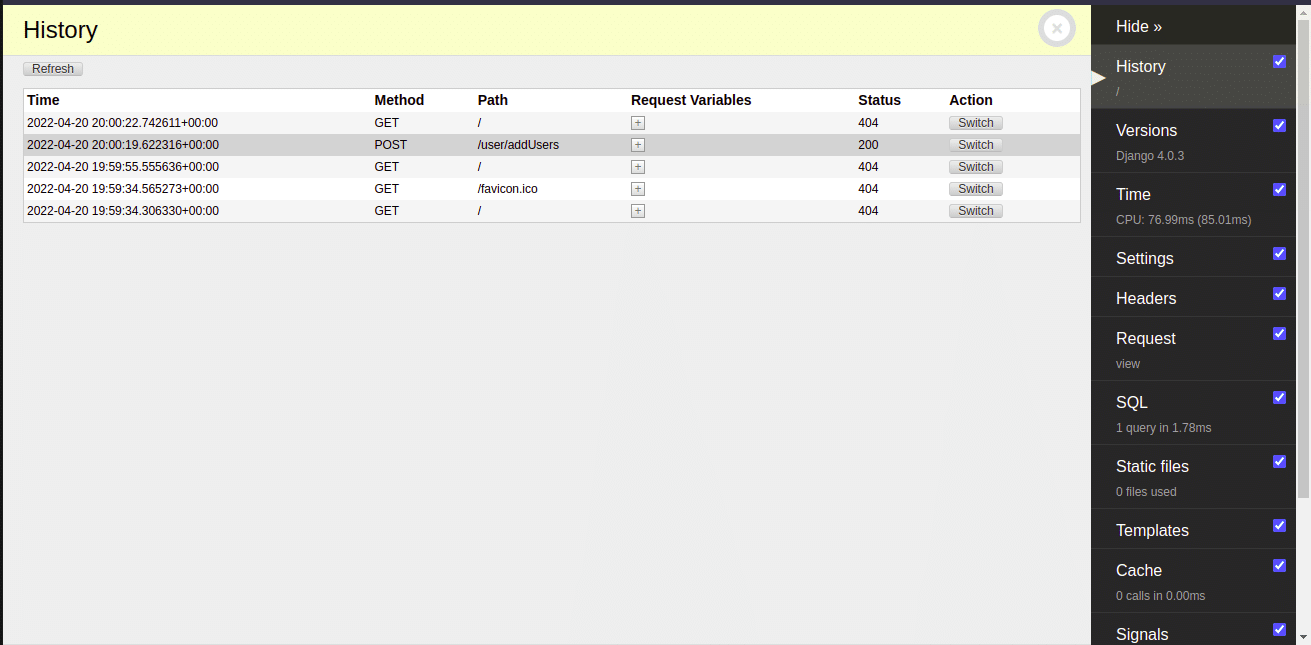
Here is an example image that is showing the history of API calls and the tab on right-hand side is showing all the features you can access using this toolbar.

The Django Debugger is a valuable tool for web developers working with Django. It helps identify and fix issues during development with features like interactive traceback and local variable inspection. The debugger allows for quick pinpointing and resolution of errors. Overall, the Django Debugger greatly enhances the debugging process and aids in building reliable applications.

We worked with Mindbowser on a design sprint, and their team did an awesome job. They really helped us shape the look and feel of our web app and gave us a clean, thoughtful design that our build team could...

The team at Mindbowser was highly professional, patient, and collaborative throughout our engagement. They struck the right balance between offering guidance and taking direction, which made the development process smooth. Although our project wasn’t related to healthcare, we clearly benefited...

Founder, Texas Ranch Security
Mindbowser played a crucial role in helping us bring everything together into a unified, cohesive product. Their commitment to industry-standard coding practices made an enormous difference, allowing developers to seamlessly transition in and out of the project without any confusion....

CEO, MarketsAI
I'm thrilled to be partnering with Mindbowser on our journey with TravelRite. The collaboration has been exceptional, and I’m truly grateful for the dedication and expertise the team has brought to the development process. Their commitment to our mission is...

Founder & CEO, TravelRite
The Mindbowser team's professionalism consistently impressed me. Their commitment to quality shone through in every aspect of the project. They truly went the extra mile, ensuring they understood our needs perfectly and were always willing to invest the time to...

CTO, New Day Therapeutics
I collaborated with Mindbowser for several years on a complex SaaS platform project. They took over a partially completed project and successfully transformed it into a fully functional and robust platform. Throughout the entire process, the quality of their work...

President, E.B. Carlson
Mindbowser and team are professional, talented and very responsive. They got us through a challenging situation with our IOT product successfully. They will be our go to dev team going forward.

Founder, Cascada
Amazing team to work with. Very responsive and very skilled in both front and backend engineering. Looking forward to our next project together.

Co-Founder, Emerge
The team is great to work with. Very professional, on task, and efficient.

Founder, PeriopMD
I can not express enough how pleased we are with the whole team. From the first call and meeting, they took our vision and ran with it. Communication was easy and everyone was flexible to our schedule. I’m excited to...

Founder, Seeke
We had very close go live timeline and Mindbowser team got us live a month before.

CEO, BuyNow WorldWide
If you want a team of great developers, I recommend them for the next project.

Founder, Teach Reach
Mindbowser built both iOS and Android apps for Mindworks, that have stood the test of time. 5 years later they still function quite beautifully. Their team always met their objectives and I'm very happy with the end result. Thank you!

Founder, Mindworks
Mindbowser has delivered a much better quality product than our previous tech vendors. Our product is stable and passed Well Architected Framework Review from AWS.

CEO, PurpleAnt
I am happy to share that we got USD 10k in cloud credits courtesy of our friends at Mindbowser. Thank you Pravin and Ayush, this means a lot to us.

CTO, Shortlist
Mindbowser is one of the reasons that our app is successful. These guys have been a great team.

Founder & CEO, MangoMirror
Kudos for all your hard work and diligence on the Telehealth platform project. You made it possible.

CEO, ThriveHealth
Mindbowser helped us build an awesome iOS app to bring balance to people’s lives.

CEO, SMILINGMIND
They were a very responsive team! Extremely easy to communicate and work with!

Founder & CEO, TotTech
We’ve had very little-to-no hiccups at all—it’s been a really pleasurable experience.

Co-Founder, TEAM8s
Mindbowser was very helpful with explaining the development process and started quickly on the project.

Executive Director of Product Development, Innovation Lab
The greatest benefit we got from Mindbowser is the expertise. Their team has developed apps in all different industries with all types of social proofs.
Co-Founder, Vesica
Mindbowser is professional, efficient and thorough.
Consultant, XPRIZE
Very committed, they create beautiful apps and are very benevolent. They have brilliant Ideas.

Founder, S.T.A.R.S of Wellness
Mindbowser was great; they listened to us a lot and helped us hone in on the actual idea of the app. They had put together fantastic wireframes for us.

Co-Founder, Flat Earth
Ayush was responsive and paired me with the best team member possible, to complete my complex vision and project. Could not be happier.

Founder, Child Life On Call
The team from Mindbowser stayed on task, asked the right questions, and completed the required tasks in a timely fashion! Strong work team!
CEO, SDOH2Health LLC
Mindbowser was easy to work with and hit the ground running, immediately feeling like part of our team.

CEO, Stealth Startup
Mindbowser was an excellent partner in developing my fitness app. They were patient, attentive, & understood my business needs. The end product exceeded my expectations. Thrilled to share it globally.

Owner, Phalanx
Mindbowser's expertise in tech, process & mobile development made them our choice for our app. The team was dedicated to the process & delivered high-quality features on time. They also gave valuable industry advice. Highly recommend them for app development...

Co-Founder, Fox&Fork