
Healthcare leadership: Turning strategy into compliant, market-ready healthcare solutions.
Read More
Empowering payors with intelligent, compliant solutions for seamless healthcare operations.
Read More
Transforming healthcare delivery through AI-powered automation & regulatory expertise.
Explore Solutions
Accelerating healthcare interoperability with secure, HL7 & FHIR-driven integrations.
Explore Solutions
Accelerating SMART on FHIR app development with secure, compliant healthcare data access.
Explore Solutions
Epic EHR Explained: How It Transforms Healthcare Operations and Patient Care
Read More →
A Complete Breakdown of the 13 Steps of Revenue Cycle Management
Read More →
Wearable App Development Solutions: A Complete Guide For 2025
Read More →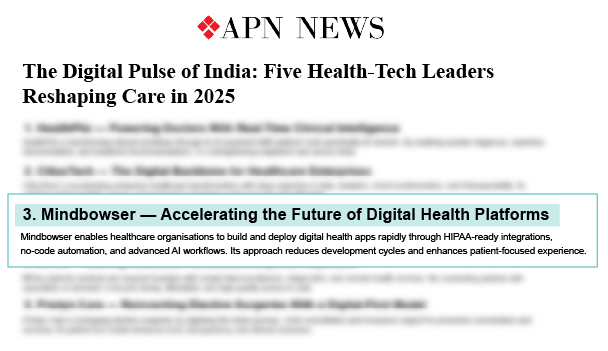
The Digital Pulse of India: Five Health-Tech Leaders Reshaping Care in 2025
Read More →Manisha Khadge Honored with Healthcare Excellence & Leadership Award 2025
Read More →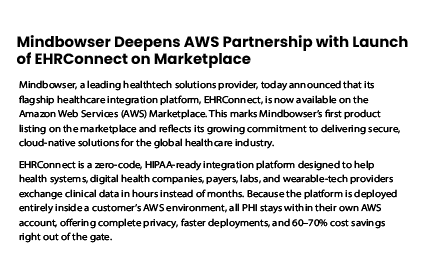
Mindbowser Deepens AWS Partnership with Launch of EHRConnect on Marketplace
Read More →
Healthcare Platform Cuts Cloud Costs by 40% with Strategic AWS Migration
Read More →
Improved Predictive Accuracy in Childbirth with Advanced EHR Integration
Read More →
Changing the Health Management with Integration of Wearable Data and Medical Expertise
Read More →
Beyond Design: Why Compliance First Discovery is Your Competitive Edge
Watch Now →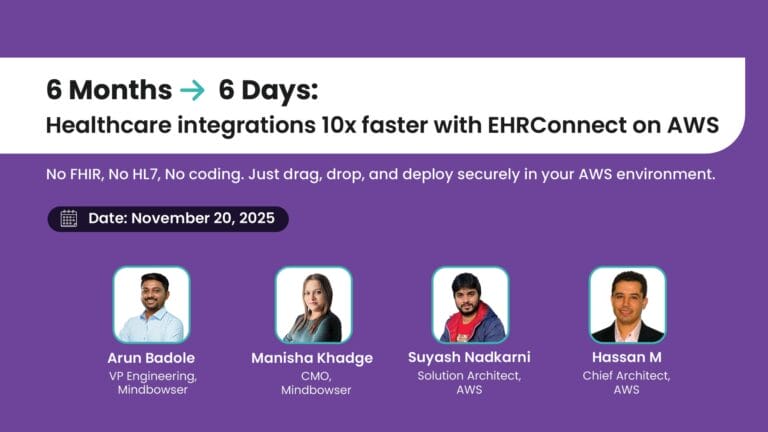
Simplifying Healthcare Integration on AWS with EHRConnect
Watch Now →
How to Integrate with EHR: A Developer’s Playbook
Watch Now →
Tune into expert-led healthcare podcasts on innovation, compliance, & digital transformation.
Watch Now →
Intelligent Health AI Basel, Switzerland September 09 – 10, 2025
Read More →
CogX Festival AI Summit London, UK September 23, 2025
Read More →
HLTH USA The Venetian Expo Center, Las Vegas, USA October 19 – 22, 2025
Read More →